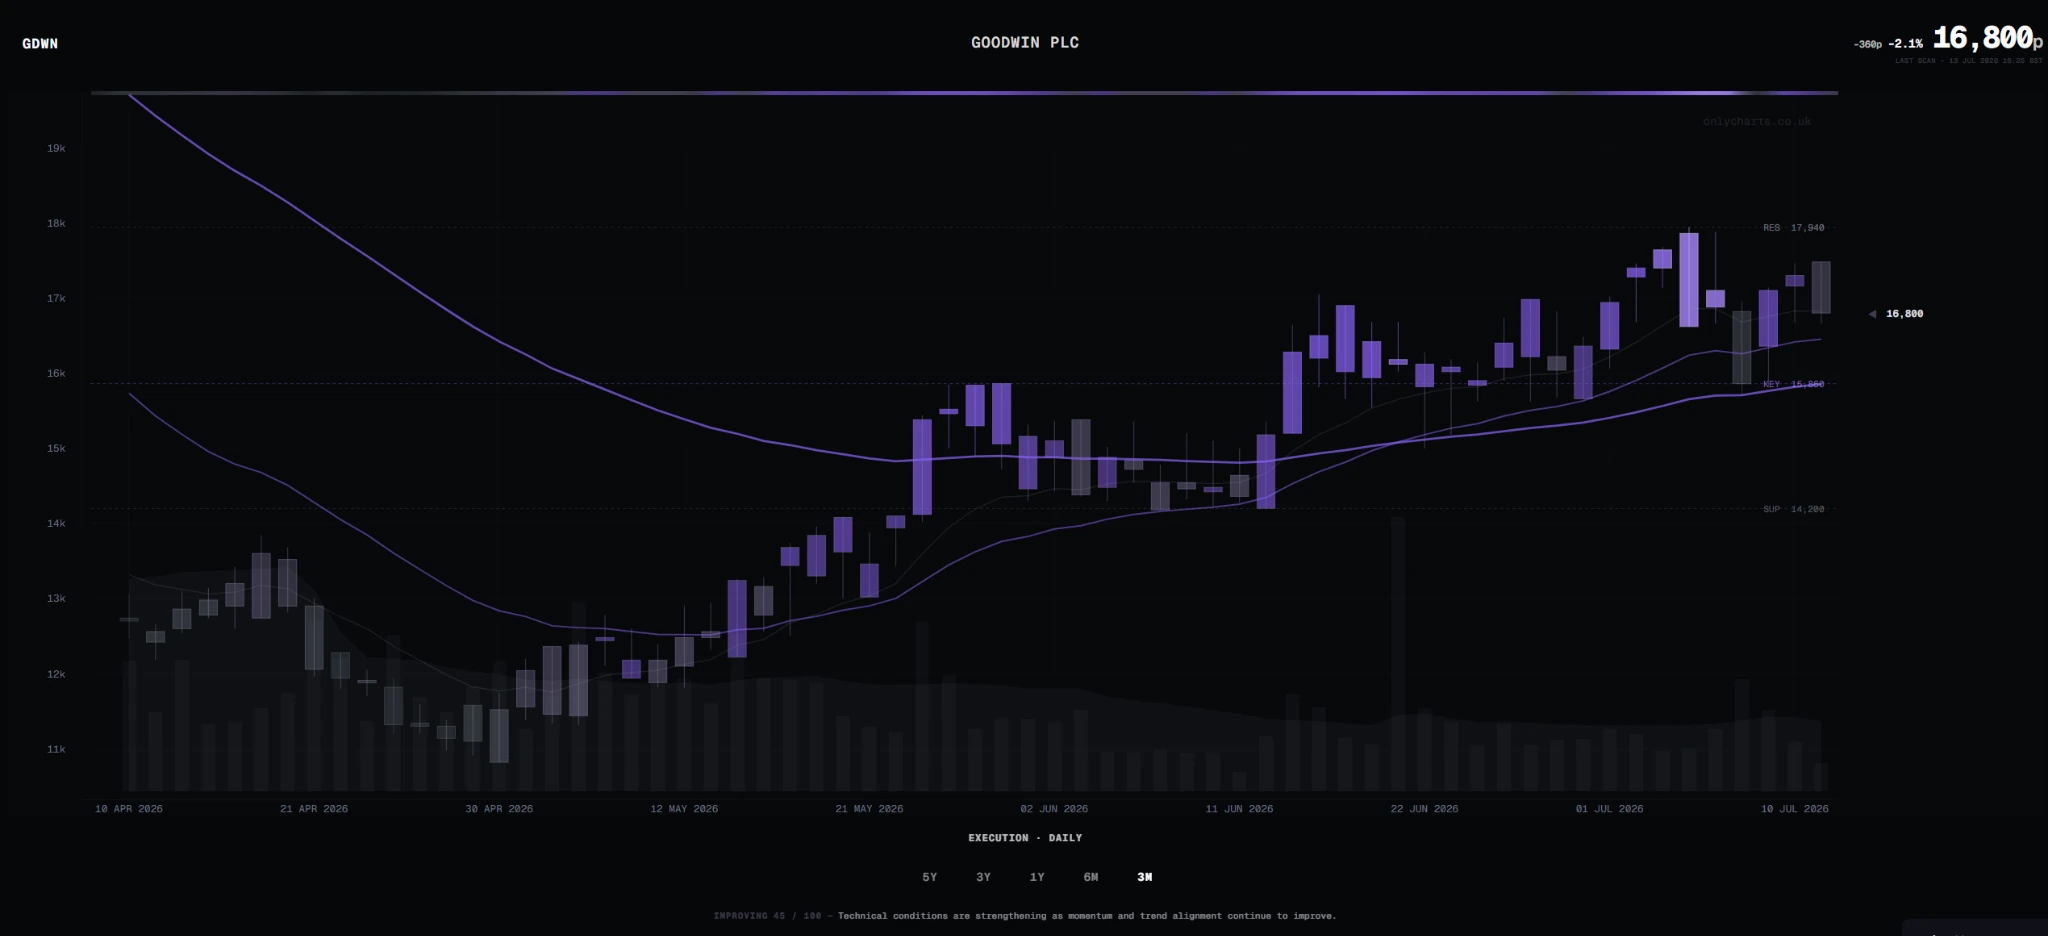
A chart can be technically strong and still sit in a poor current location. Strength describes the evidence. Location describes the price you are being asked to accept relative to support, the key level and resistance.
Chasing usually happens after the obvious move, when recent performance is strong, social attention is rising and the clean decision area is already far below.
Measure distance from the levels.
Use the structure panel to see how far price sits from support, the key level and resistance. A large gap to support means a normal pullback can be substantial even if the wider chart remains constructive.
A small gap to resistance can also reduce the immediate room available before the chart meets an area of prior supply. The percentages are context, not targets or a calculation of expected return.
Compare longer and shorter views.
A 3M execution chart can appear extended while the 3Y structural chart remains early in a much larger recovery. The opposite can also happen: a short-term breakout may be running directly into major long-term resistance.
Move from 5Y and 3Y into 1Y, 6M and 3M. The broad view tells you whether the move is strategically mature; the shorter view tells you whether the current location is stretched.
Read momentum after a large move.
Accelerating momentum near a clean breakout area is different from accelerating momentum after a vertical run. The latter can remain strong, but the distance to a defensible level may already be large.
Fading momentum does not automatically mean the move is over. It can describe a healthy pause. The important question is whether price holds structure while pressure cools.
Read volume in context.
Elevated volume as price leaves a long base can support the idea that participation is broadening. A sudden volume spike after a prolonged rise can be more ambiguous because late demand may be meeting earlier holders taking profits.
Light volume after a sharp run reduces confirmation, but it does not guarantee a reversal. Use the volume read with the levels and the candle behaviour.
What a cleaner area can look like.
- A controlled pullback that holds above support or a reclaimed key level.
- A sideways consolidation that allows the trend rails to catch up.
- A retest of old resistance that behaves as new support.
- Momentum cooling without a structural breakdown.
- Renewed participation as price leaves the consolidation.
None of these conditions guarantees a favourable outcome. They simply create a clearer relationship between the current price and the point at which the chart would begin to weaken.
Common chasing mistakes.
- Buying because the score is high without checking distance to support.
- Treating resistance as a guaranteed target rather than an area of supply.
- Ignoring a wide spread after a fast small-cap move.
- Assuming a high-volume spike is necessarily continuation.
- Using the 3M view while ignoring a mature 5Y move.
- Changing the risk framework because the story feels exciting.