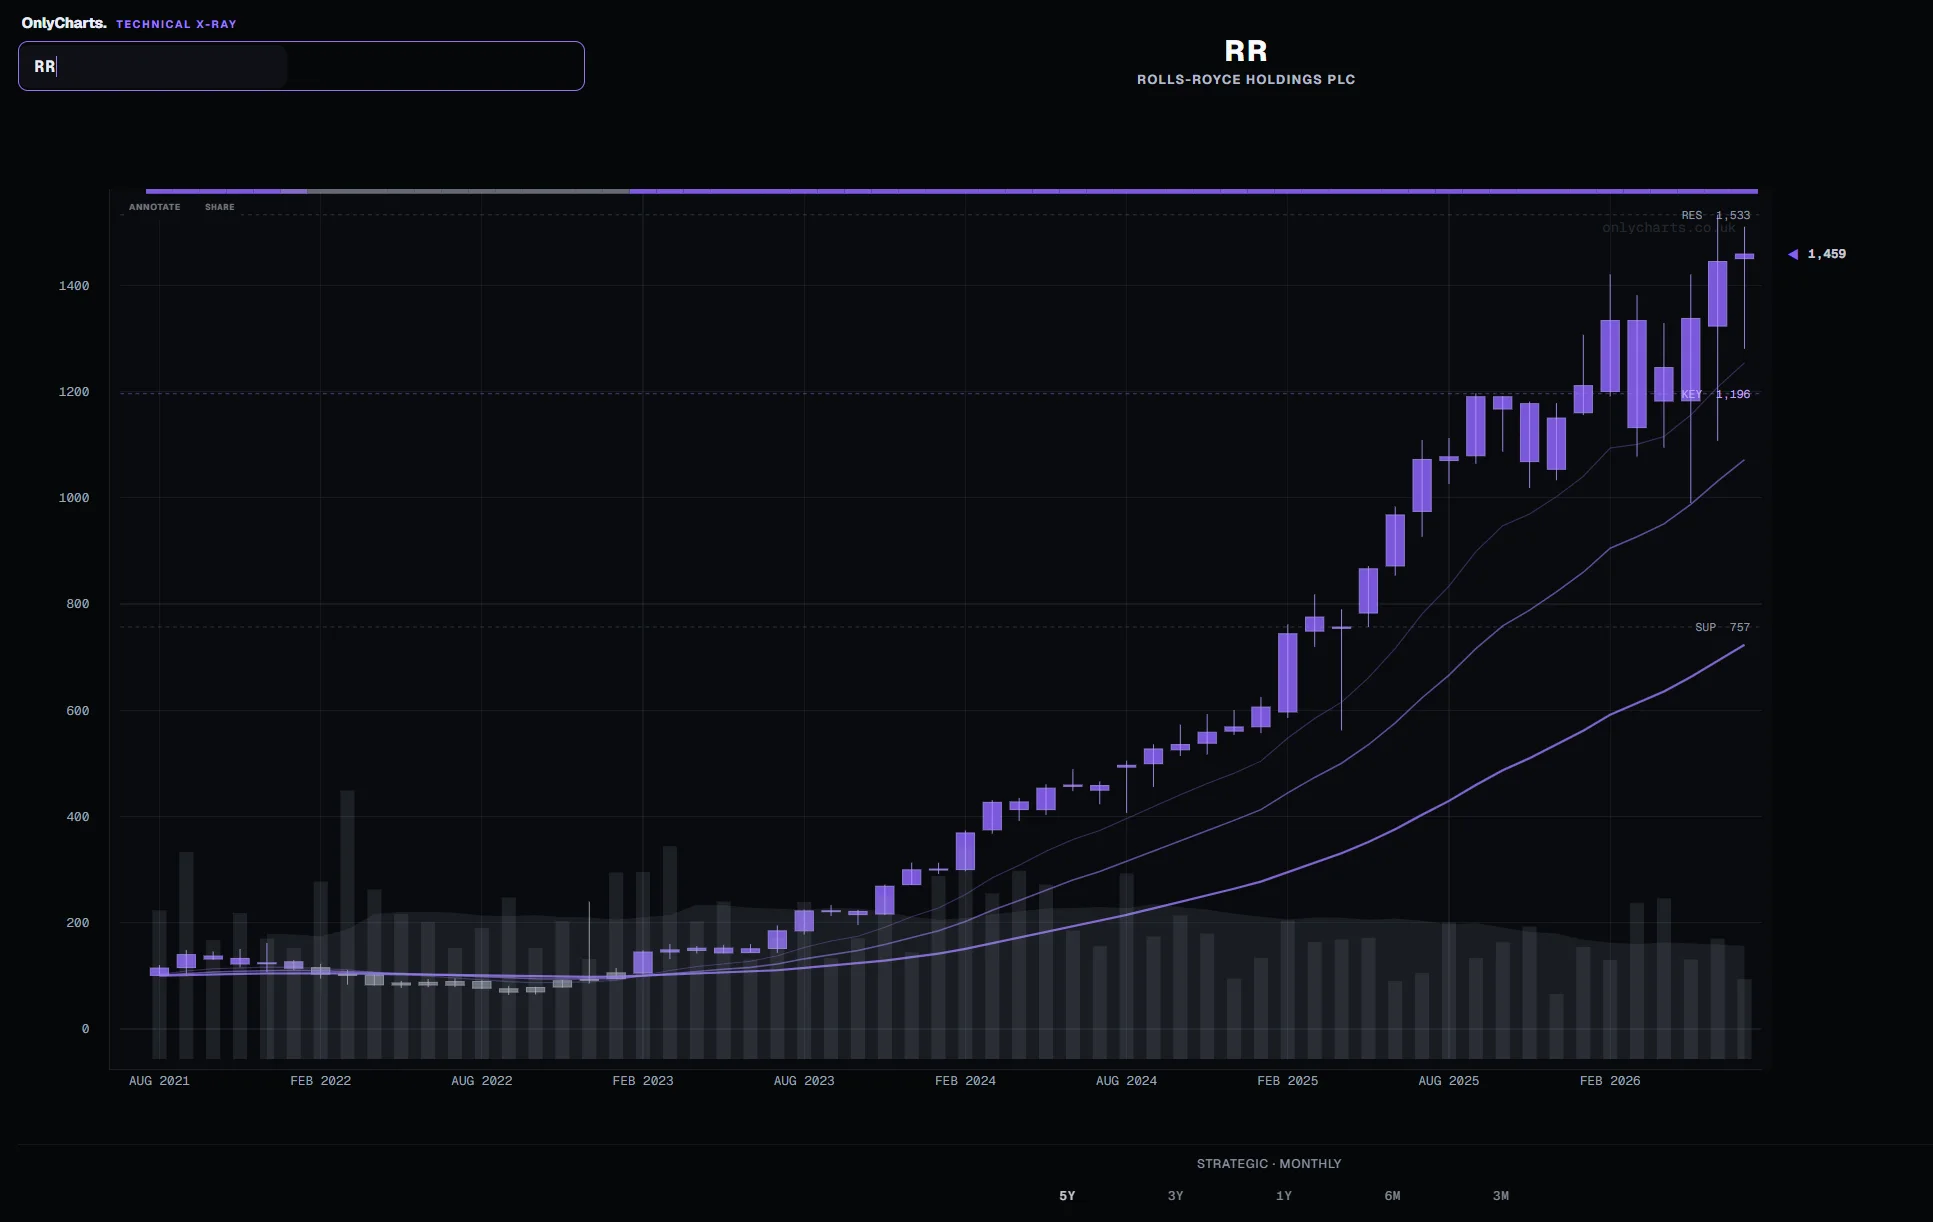
OnlyCharts is a chart-reading product. Enter a ticker, run the Technical X-Ray and get one clear diagnosis before opening the supporting detail.
What happens when you run an X-Ray.
- Enter a listed ticker.
- The Technical X-Ray reads the chart through five evidence areas.
- Read the diagnosis first.
- Use the Health Score to compare the strength of the read.
- Inspect the evidence, levels and timeframe context.
The product is designed to make the current chart condition easier to understand without turning the result into a recommendation.
One product. Three layers.
Critical, Weak, Recovering, Healthy or Strong describes the chart's current technical condition.
A 0–100 measure makes the strength of the read easier to compare across shares and timeframes.
Trend, momentum, relative strength, volume and structure explain why the X-Ray reached its diagnosis.
The same method every time.
Each evidence area is assessed independently before the readings are combined into the diagnosis and Health Score.
The public Technical X-Ray methodology explains what the output means, how the evidence is handled and where the production calibration remains proprietary.
What the score is not
A Health Score is not a probability that the share price will rise. It is a description of current technical condition on the selected timeframe.
UK-first by design.
OnlyCharts is built around the realities of AIM, the Main Market and UK small- and mid-cap shares: inconsistent liquidity, wide spreads, irregular volume and charts that can behave differently from highly liquid US mega-caps.
Normal London tickers can be entered without an exchange suffix. Major US shares are supported, but the product language and use cases remain grounded in the UK investor workflow.
Four product principles.
Product boundaries.
OnlyCharts does not value companies, assess management, review announcements, determine suitability or measure executable liquidity. It does not provide personalised advice, price targets or recommendations.
Market data may be delayed, incomplete or inaccurate. Forming candles are identified because price, volume and the resulting diagnosis can change before the period closes.
Read the Important Information before relying on any output.