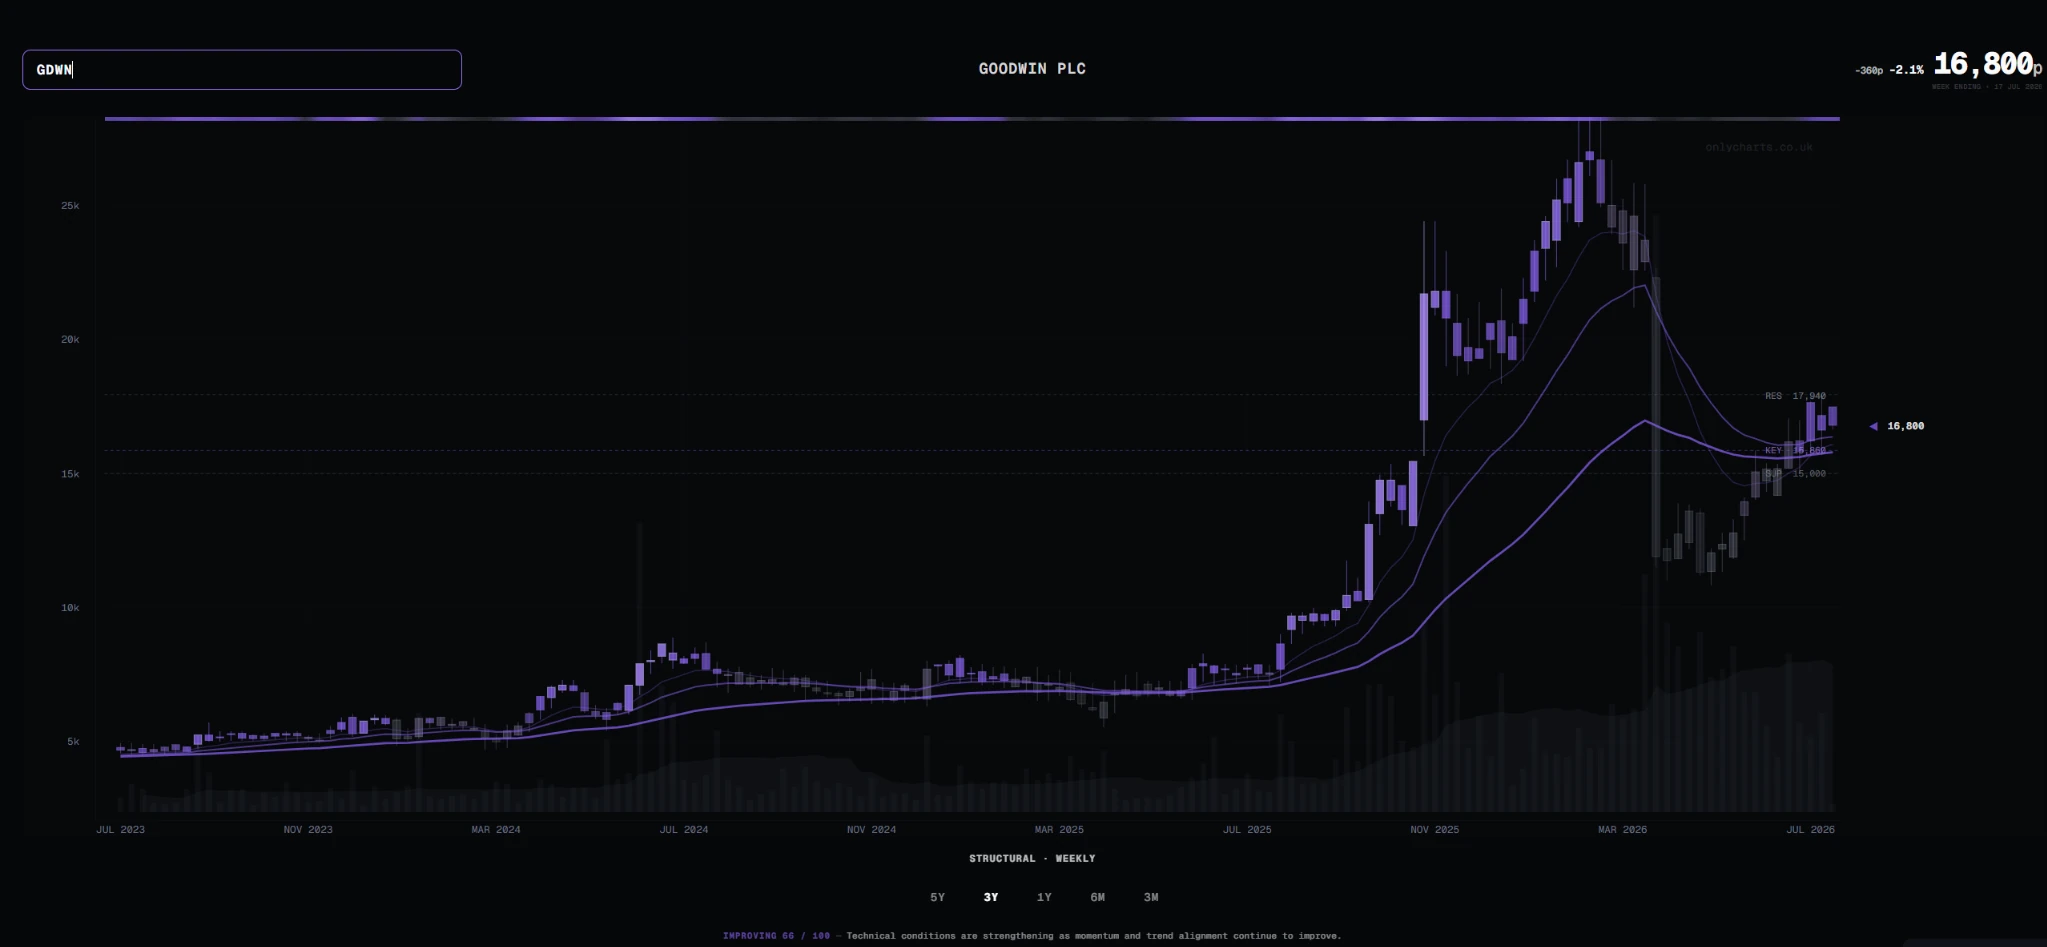
I review thousands of charts each year. The challenge is not opening them. It is reaching a clear, consistent diagnosis from complex and sometimes conflicting evidence.
At the beginning of the day, and again after the market closes, I review the charts of companies in my portfolio and on my watchlist. As that list grows, clarity becomes the scarce resource.
Without a repeatable process, the loudest story, the most recent price move or the chart I already want to like can dominate the read. I wanted one method that made the condition easier to see.
Fundamentals first.
I am not trying to predict what a share price will do tomorrow. I normally invest with a medium- to long-term horizon, holding for months and sometimes years.
Fundamental research comes first: the business, valuation, balance sheet, management, catalyst and liquidity still matter. Technical analysis helps me decide where to focus that work and whether market behaviour is beginning to support—or contradict—an idea.
The principle
The market may not always be right about value. It is always right about price.
Existing products left a gap.
They are powerful for screening, ranking and company research, but chart interpretation can feel like an afterthought.
Indicators stacked on indicators, endless timeframe combinations and more detail than a medium-term investor needs for a clear first read.
I did not need another blank chart or a cockpit of tools. I needed one clear diagnosis and the evidence behind it.
See the chart clearly.
What condition is this chart in now? Is it strengthening, weakening or damaged—and what evidence supports that diagnosis?
That question is deliberately narrower than “what should I buy?” It is useful precisely because it does not pretend to replace valuation, company research or judgement.
The same five questions for every share.
OnlyCharts combines that evidence into one Health Score and a plain-English diagnosis: Critical, Weak, Recovering, Healthy or Strong. The evidence remains visible, so the conclusion can be inspected rather than merely accepted.
Where the X-Ray fits.
- Start with an idea, holding or watchlist.
- Run the Technical X-Ray.
- Read the diagnosis and Health Score.
- Inspect the supporting evidence and timeframe context.
- Make the investment decision independently.
The X-Ray also makes monitoring more consistent. When chart condition changes, the diagnosis and evidence make that change easier to see without replacing the wider investment work.
What the X-Ray cannot tell me.
It cannot value a business, assess management quality, read a regulatory announcement, measure executable liquidity or determine the right position size. It cannot forecast news or guarantee that a support level will hold.
A technically healthy share can still be fundamentally poor or too expensive. A weak chart can belong to a sound business that needs more time. Market data can also be delayed, incomplete or inaccurate.
Product boundary
OnlyCharts describes current technical condition. It does not issue buy, sell or hold recommendations.
Clarity, repeated.
The product is the discipline of asking the same questions, in the same way, every time. The chart remains the centre of the experience; the X-Ray makes its condition easier to understand.
That is the idea behind OnlyCharts: one diagnosis, one Health Score and supporting evidence that can be inspected.