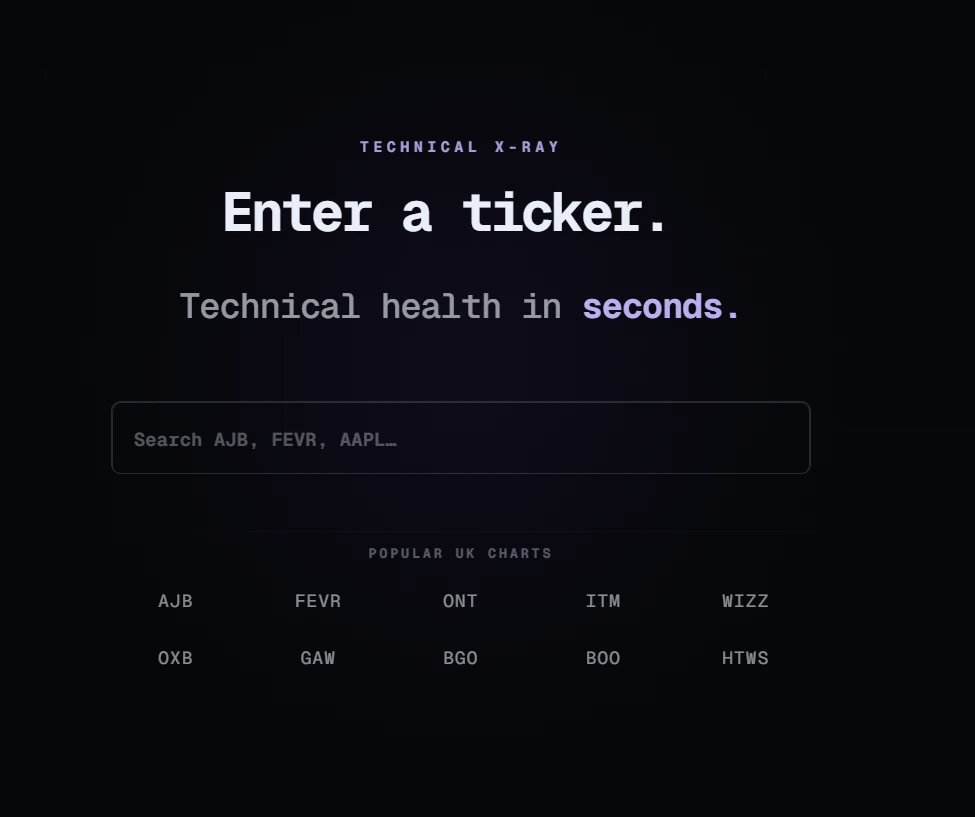
Step 1 — Enter a ticker.
OnlyCharts is built to answer one question quickly: what condition is this chart in now—and what evidence supports that read?
Enter the exact listed ticker in the search field. The product is UK-first, so a normal London-market symbol such as FEVR, GDWN or AJB can be entered without an exchange suffix. The landing page also provides a small group of example tickers as shortcuts.
Use the listed symbol
If a company has changed ticker, delisted or lacks usable market history, OnlyCharts may not be able to return a chart.
Step 2 — Let the X-Ray build the read.
After submission, OnlyCharts loads the relevant price history, calculates the five evidence readings and builds the chart.
The scan animation is a transition into the result, not a claim of certainty. The output is an automated technical classification—not a recommendation or a live market guarantee.
When the chart appears, the top rail shows the instrument, latest available price and the freshness of the displayed candle. Daily views may include a still-forming session, so some values can change before the market closes.
Step 3 — Read the diagnosis first.
Every X-Ray begins with one of five diagnoses: Critical, Weak, Recovering, Healthy or Strong. Beside it sits the Health Score from 0 to 100.
Use the diagnosis and score as orientation, not instruction. They show where the current technical evidence sits on the OnlyCharts scale; they do not tell you whether a share is cheap, suitable for you or certain to rise.
Then inspect the evidence. Two charts can share the same score while arriving there through very different combinations.
Step 4 — Open the evidence, not just the score.
Is the directional framework constructive, mixed or weakening?
Is pressure accelerating, recovering, stable, fading or deteriorating?
Is the share leading or lagging its stated benchmark?
Is participation supporting, contradicting or failing to confirm the move?
Where is price inside the current decision range?
The value lies in the combination. Constructive trend with fading momentum says something different from improving momentum below a key level.
Go deeper
The Technical X-Ray methodology explains the public evidence architecture, data safeguards, diagnosis meanings and proprietary disclosure boundary.
Step 5 — Read the visual language.
OnlyCharts expresses technical condition through more than a number. Colour, contrast and emphasis help the current diagnosis register before every metric has been read.
The presentation supports the diagnosis but never changes the underlying Health Score or evidence. Always confirm the visual read by inspecting trend, momentum, relative strength, volume and structure.
Read colour as context
The visual treatment reflects the current model output for the selected timeframe. Always confirm the diagnosis by reading the supporting evidence underneath it.
Step 6 — Zoom out before you zoom in.
The diagnosis can change by timeframe because each view asks a different technical question. Start broad, then move shorter.
| View | Candles | Primary use |
|---|---|---|
| 5Y · Strategic | Monthly | Long-cycle direction, historic bases and major re-ratings. |
| 3Y · Structural | Weekly | Multi-year structure, major levels and durable trend changes. |
| 1Y · Trend | Daily | The primary daily trend and current-year condition. |
| 6M · Tactical | Daily | The active swing, participation and tactical levels. |
| 3M · Execution | Daily | Current price location, momentum and near-term decision areas. |
A strong three-month chart can still sit inside damaged three-year structure. A weak three-month chart can be a normal pause inside a constructive longer trend. The sequence matters.
Step 7 — Hover the history.
The X-Ray follows the cursor. Hovering a candle shows the diagnosis and evidence associated with that point in the available history.
Use it to see when trend alignment repaired, when momentum began to fade or when relative strength stopped confirming the move. The chart becomes a diagnostic timeline rather than a single latest score.
Historical classifications remain automated model outputs based on available market data. They are not a record of what an investor should have done at the time.
Step 8 — Repeat the same review every time.
- Enter the ticker and note the current diagnosis and score.
- Start with the 5Y and 3Y views to establish context.
- Move through 1Y, 6M and 3M to reach the current setup.
- Check price against support, the key level and resistance.
- Ask whether momentum and relative strength confirm the trend.
- Read volume as participation—not as direction by itself.
- Decide what the chart condition means for your own process or monitoring.
Step 9 — Keep the X-Ray in its lane.
OnlyCharts does not value a business, analyse a balance sheet, assess management, review regulatory announcements or determine whether an investment is suitable for you. It does not provide buy, sell or hold instructions, price targets or personalised risk limits.
Market data can be delayed, incomplete or unavailable. Indicators, levels, scores and diagnoses can change as new data arrives. Use the X-Ray as one technical input and read the Important Information before relying on any output.