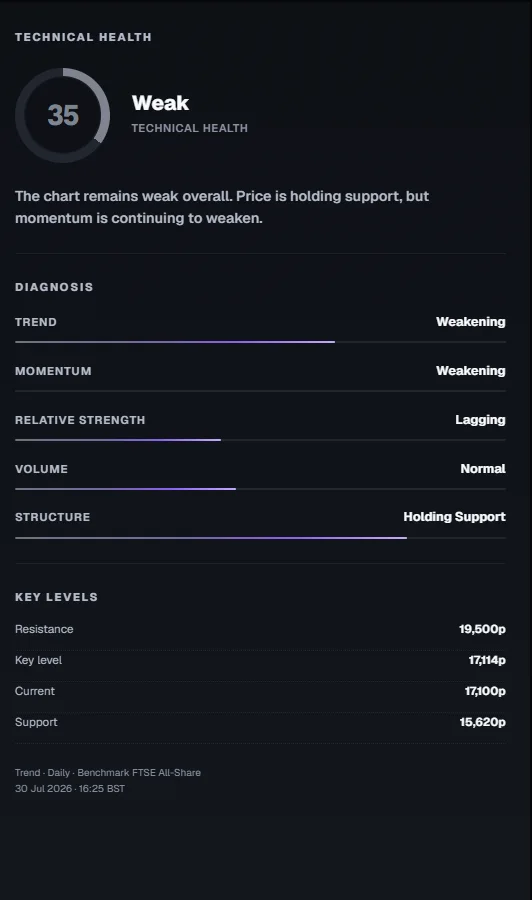
The Health Score is a 0–100 summary of current chart condition on the active timeframe. It makes one chart easier to compare with another while keeping the supporting evidence visible.
Five independently assessed pillars - Trend, Momentum, Relative Strength, Volume and Structure - are combined through a fixed proprietary synthesis. The diagnosis translates the continuous score into a plain-English state.
Important
A score of 70 does not mean a 70% chance that the share will rise.
The five diagnosis states.
| Diagnosis | Plain-English read |
|---|---|
| Critical | Weakness is broad or severe across the evidence stack. |
| Weak | Conditions remain defensive, fragile or insufficiently repaired. |
| Recovering | Evidence is strengthening, but remains mixed or incomplete. |
| Healthy | The main pillars are constructive and the chart is broadly intact. |
| Strong | Core directional evidence is well aligned. |
The exact category boundaries remain proprietary. The meaning of each state is public and deliberately stable.
The evidence inside the score.
No pillar is intended to be read as a standalone trading signal. The value comes from agreement, conflict and change across the evidence stack.
Read the framework
The Technical X-Ray methodology explains the public architecture, workflow, safeguards and disclosure boundary.
Why the score changes by timeframe.
A five-year monthly chart and a three-month daily chart contain different information. A short-term correction can sit inside a healthy long-term trend, while a short rally can occur inside damaged long-term structure.
OnlyCharts recalculates the evidence for the active view. Compare like with like and move from long-cycle context towards the current decision area.
How to read conflicting pillars.
A Recovering diagnosis often contains both constructive and defensive evidence. Momentum may be repairing while the broader trend or market leadership remains weak. A Healthy diagnosis may still carry a caution if price is close to resistance or participation is light.
Use the score for orientation, then inspect which pillar is driving the conclusion and which pillar is preventing a stronger state.
How to use the score.
- Read the diagnosis before the number.
- Inspect the strongest and weakest pillars.
- Check support, the key level and resistance.
- Compare the longer and shorter timeframes.
- Define what would improve or invalidate the read.
What the score is not.
It is not a valuation, recommendation, probability, price target or suitability assessment. It does not measure spread, order-book depth, management quality or fundamental risk.
OnlyCharts is a technical research and decision-support tool. The investor remains responsible for the investment decision.