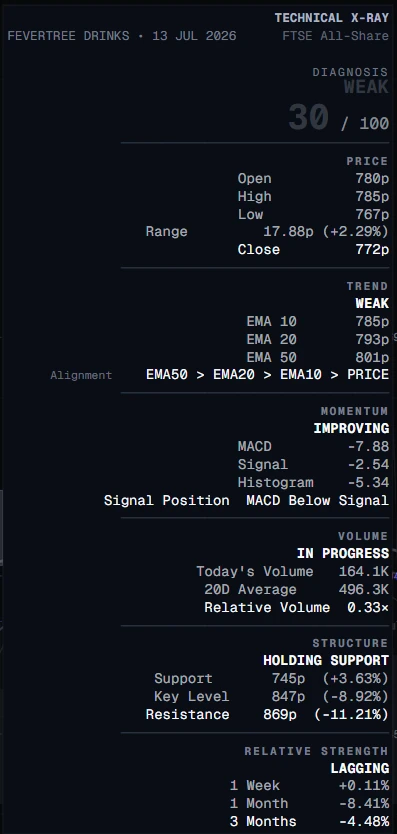
Volume shows participation. It helps answer whether the current price move is attracting meaningful activity relative to the stock’s own recent history.
It does not reveal every buyer and seller, and it does not make a price move valid by itself. The useful question is what the activity is confirming or contradicting.
Today, average and relative volume.
Comparing a stock with its own normal activity is more useful than applying one absolute volume number to every company.
Light, normal, elevated and heavy.
The current hover model uses broad participation bands:
| Relative volume | Label | Interpretation |
|---|---|---|
| Below 0.75× | Light | Activity is materially below the recent average. |
| 0.75× to 1.14× | Normal | Participation is close to the stock’s recent norm. |
| 1.15× to 1.49× | Elevated | Activity is meaningfully above normal. |
| 1.50× and above | Heavy | The session is attracting unusually high activity. |
These are descriptive bands, not trade instructions. The model may evolve as OnlyCharts develops.
What “In Progress” means.
On a daily chart, the latest session may still be forming. If intraday data is available for that same date, OnlyCharts can build a partial daily candle and mark the volume state as In Progress.
That prevents a morning volume total from being treated as though it were a completed day. The final relative-volume reading can change substantially before the close.
High volume is not automatically bullish.
Elevated activity through resistance with strong price behaviour can support a constructive read. Elevated activity during a breakdown can confirm aggressive selling. Heavy volume after a vertical rise can also reflect late demand meeting distribution.
Read volume alongside the candle, momentum, structure and trend. The same 2.0× relative-volume number can carry opposite implications depending on price behaviour.
Why this matters more in small caps.
Many AIM and UK small-cap shares trade unevenly. A price can move sharply because very little stock is available, not because a broad group of buyers has appeared. Relative volume helps distinguish a more active move from a thin drift.
Even then, share volume can overstate the financial weight of activity in very low-priced shares. The number of shares traded is not the same as the value of money traded.
Volume is not liquidity.
The current X-Ray provides participation context. It does not show a live bid-offer spread, order-book depth, executable quote or the impact of your own order size.
A stock can display reasonable chart volume and still be difficult to trade in size. Check the live market, spread and normal traded value separately. Read the dedicated liquidity guide before treating volume as evidence of easy execution.