Liquidity is the ability to buy or sell a share in a sensible size without moving the market excessively or accepting an unexpectedly poor price.
It depends on more than the number of shares traded. Spread, market depth, typical traded value, available counterparties and the size of your own order all matter.
Why it matters in small caps.
Many AIM and UK small-cap shares have fewer active participants than large companies. Quotes can be wider, trades can be irregular and one order can move the displayed price materially.
That creates a practical difference between a chart that looks attractive and a position that can be entered or exited efficiently. Execution risk can dominate the theoretical chart setup.
What the X-Ray can show.
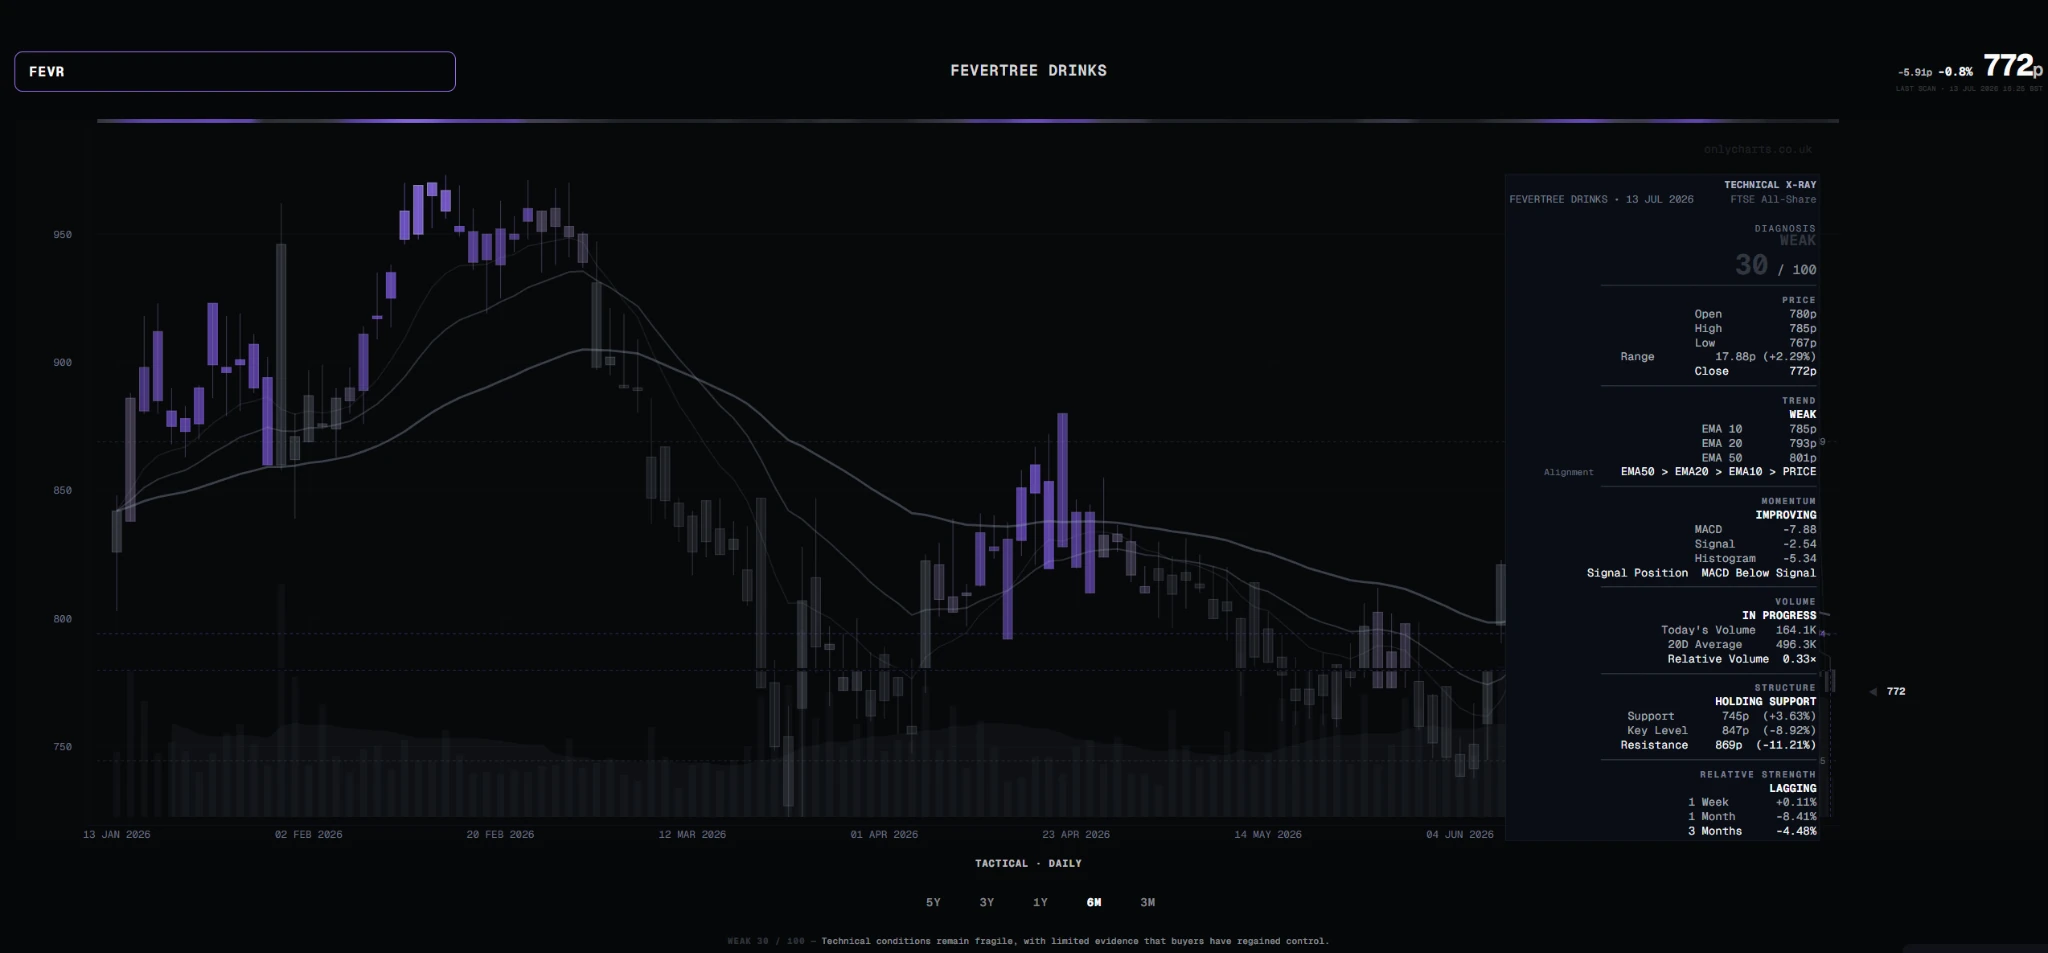
OnlyCharts currently provides participation context through today’s volume, the 20-day average and relative volume. This can show whether the latest move is occurring on light, normal, elevated or heavy activity relative to the stock’s own history.
That evidence is useful. A move on unusually light activity may be less robust than a move with broad participation. But it is not a complete liquidity measurement.
What the X-Ray does not show.
Spread and execution risk.
A wide bid-offer spread creates an immediate cost. If the displayed market is 90p bid and 100p offer, buying at the offer and marking the position at the bid creates a significant initial gap even if the mid-price appears unchanged.
Quoted prices can also be indicative rather than available in the size you need. Check an executable quote with your broker before acting.
Position size and traded value.
One million shares traded in a 1p company represents far less money than one million shares traded in a 100p company. For execution, approximate traded value can be more informative than share count alone.
Your position should also be considered against typical daily activity. OnlyCharts cannot assess the appropriate size for your circumstances, but it can remind you that low participation warrants more caution.
A practical liquidity checklist.
- Check the live bid and offer, not only the chart’s last price.
- Review recent traded value and how often the share actually trades.
- Compare your intended order with normal activity.
- Consider how you would exit during a weak market, not only during calm conditions.
- Use limit orders and staged execution where appropriate to your own process.
- Do not infer easy execution from a high Health Score.
Current product boundary
OnlyCharts analyses chart condition and volume participation. It does not provide live execution analytics or personalised liquidity advice.