Investors already have charts and indicators. The persistent challenge is reaching one consistent judgement about whether a chart is strengthening, weakening or technically damaged.
OnlyCharts was built to reduce the time, inconsistency and cognitive load involved in reviewing many shares. It does not remove market uncertainty. It standardises the evidence used to assess that uncertainty.
The central promise
Turn complex charts into one clear diagnosis.
From chart display to chart diagnosis.
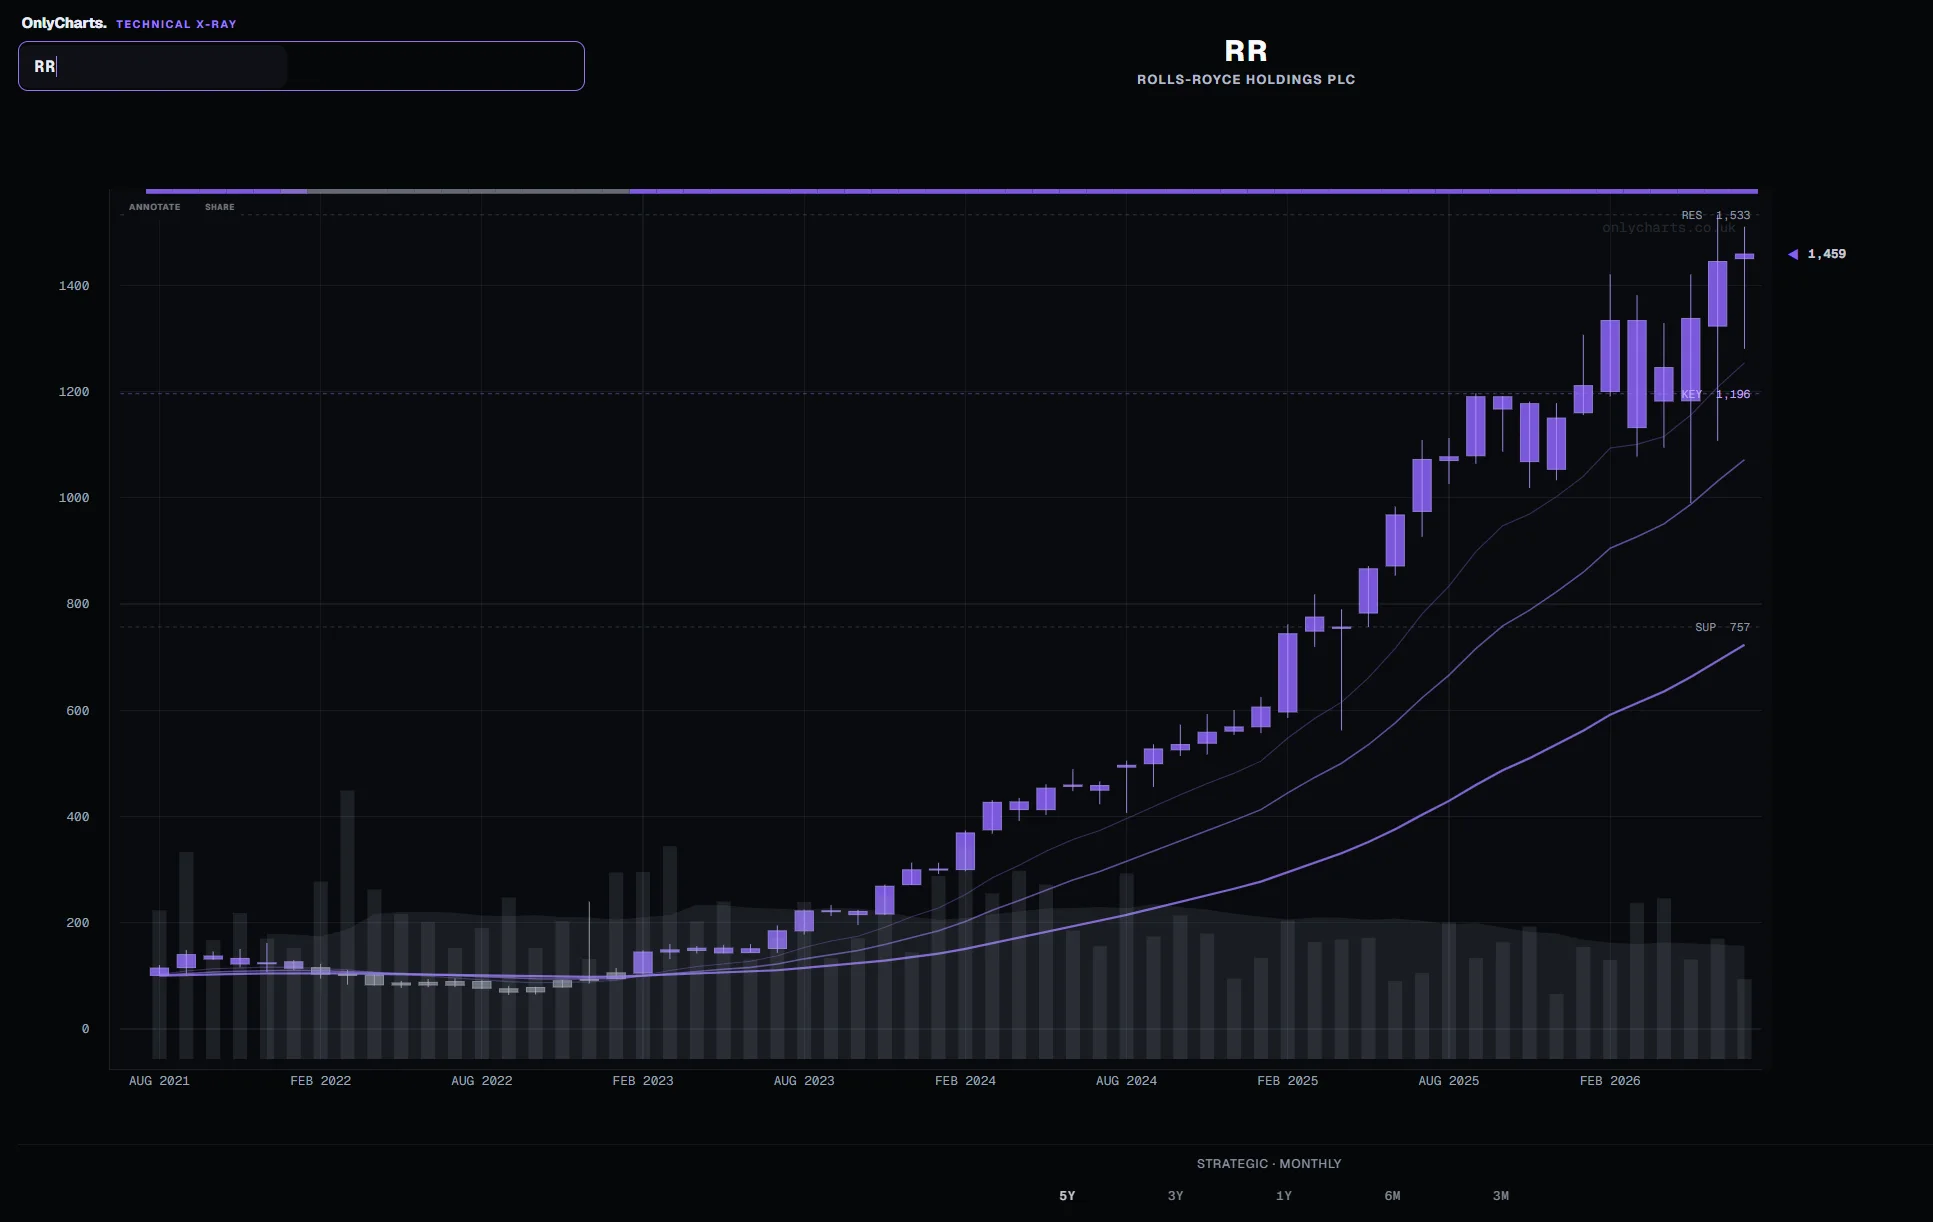
Translate the chart into one clear current-condition diagnosis.
Use one 0–100 measure across shares and timeframes.
See which parts of the chart are constructive, mixed or weak.
Separate short-term movement from longer structural condition.
Five questions before one diagnosis.
Each evidence area is assessed independently before the five readings are combined into a continuous 0–100 Health Score. No area is intended to be used as a standalone trading signal.
Not a percentage chance
A Health Score of 70 does not mean a 70% chance that the share price will rise.
Five ordered diagnoses.
Weakness is broad or severe across the evidence stack.
Conditions remain defensive, fragile or insufficiently repaired.
Evidence is strengthening, but remains mixed or incomplete.
The main pillars are constructive and the chart is broadly intact.
Core directional evidence is well aligned.
The score remains continuous. The diagnosis translates that condition into a calm, comparable state. Exact category boundaries remain proprietary.
A repeatable Technical X-Ray.
- Scan: enter the ticker and select the relevant horizon.
- Diagnose: read the diagnosis and Health Score.
- Inspect: check the supporting evidence and key levels.
- Contextualise: compare longer and shorter timeframes.
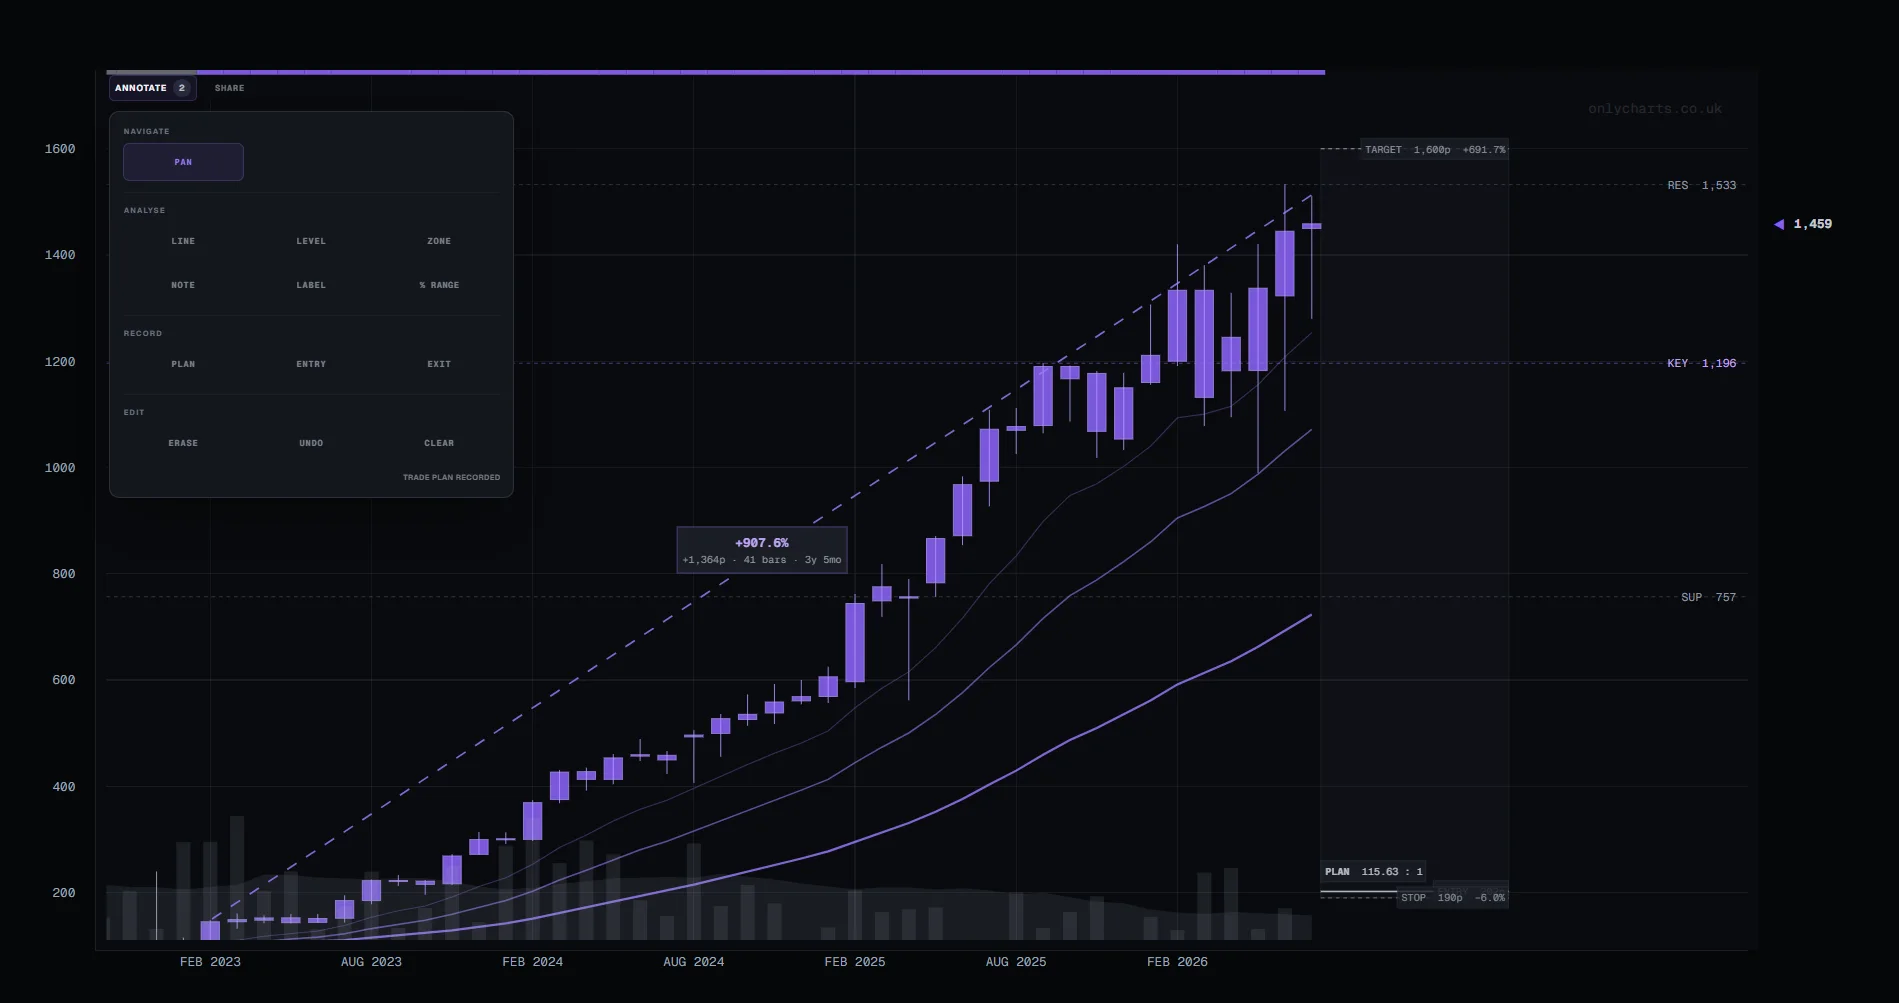
- Plan: define what would improve, confirm or invalidate the read.
Keep the decision separate
OnlyCharts reviews the technical chart. The investor still assesses the company, valuation, liquidity, position size and portfolio suitability.
Proprietary does not have to mean opaque.
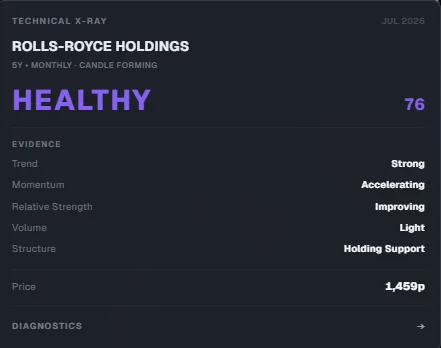
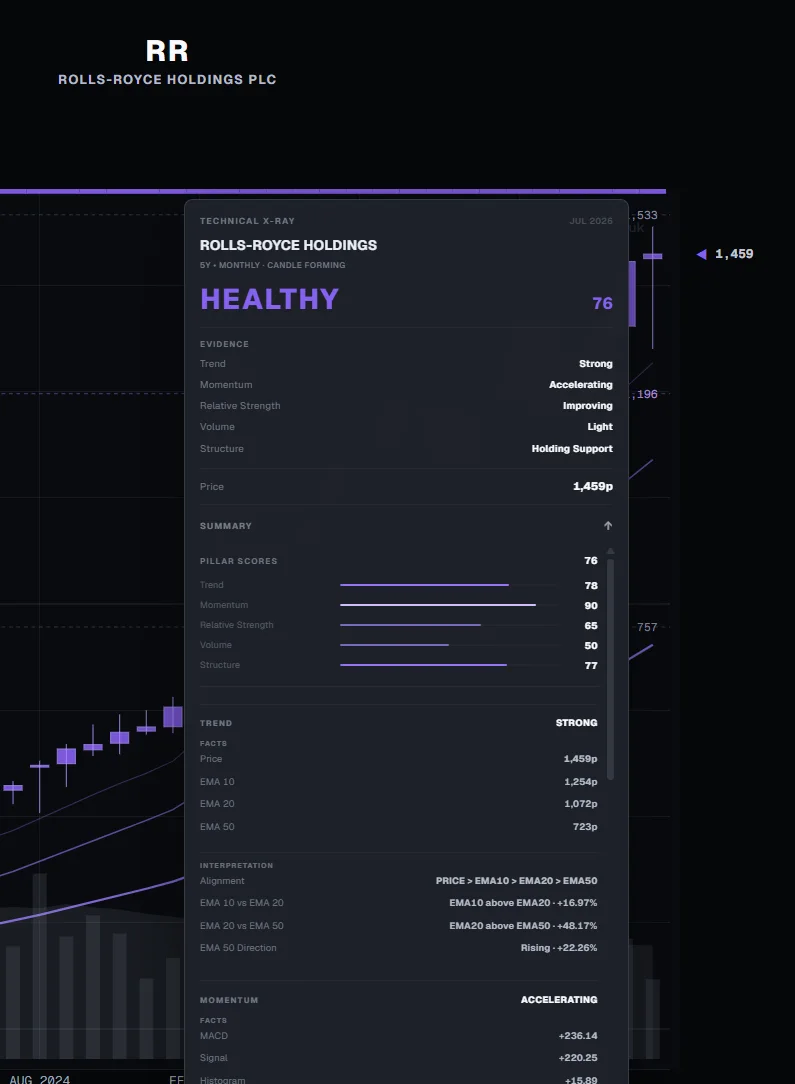
Users can inspect the active timeframe, candle date, benchmark, evidence states, evidence scores, directional facts, participation, structural levels and data coverage. A developing live candle is identified as provisional because its price and volume can still change.
Key methodological controls
- Validated OHLCV and conservative handling of missing data.
- Corporate-action-adjusted historical bars to reduce false technical signals.
- Past-only structure calculations to reduce look-ahead bias.
- Controlled benchmark alignment for relative-strength evidence.
- Warm-up requirements before a pillar is treated as fully available.
- Separation between analytical calculations and display-only continuity.
What is public - and what remains proprietary.
Purpose, evidence, diagnosis meanings, Health Score, workflow, data handling, historical controls, governance and limitations.
Exact weights, point schedules, thresholds, normalisation breakpoints, modifiers, state transitions and display-smoothing parameters.
The objective is to disclose enough for a sceptical user to understand and challenge what the diagnosis claims, without publishing the production recipe that distinguishes the product.
The web methodology covers use cases, data safeguards, multi-timeframe interpretation, governance, FAQ and glossary.
What the framework cannot do.
- It cannot value a company or assess management quality.
- It cannot measure spread, order-book depth or executable position size.
- It cannot know an investor's objectives, risk tolerance or tax position.
- It cannot guarantee that a support, key level or resistance area will hold.
- It cannot turn historical relationships into a certain forecast.
Third-party market data can be delayed, corrected, incomplete or unavailable. UK small and mid-cap shares can be volatile and illiquid, and prices can gap beyond displayed levels.
Risk statement
OnlyCharts is for research and education. It is not personalised investment advice, investment research, a recommendation, a price target or a guarantee of future performance. Capital is at risk.
Frequently asked questions.
Does a Strong diagnosis mean a share will rise?
No. It means the current technical evidence is strongly aligned on the selected timeframe.
Why can timeframes disagree?
They use different bars and answer different questions. A short-term correction can sit inside a healthy long-term trend.
Can a diagnosis change intraday?
Yes. A developing candle and its volume can change before the market closes.
Why is the full algorithm not published?
Users need enough information to understand the output and its limits. Publishing the production calibration would remove the proprietary distinction without improving the meaning of the diagnosis.
Technical X-Ray Methodology v2.0 reflects the public product method as at 30 July 2026. Material changes to the meaning of the diagnosis should be documented in a later version.