Stop stitching indicators together.
The X-Ray synthesises the evidence before you inspect the detail.
The problem it removes
Trend can look strong while momentum fades. Volume can rise into resistance. One timeframe can look healthy while another is deteriorating. Most charting tools show you the pieces and leave you to resolve the contradiction.
One coherent technical condition, backed by the same evidence you can inspect.
Run the live RR X-RayThe X-Ray synthesises the evidence before you inspect the detail.
Every chart is read through the same five-pillar framework.
The diagnosis, Health Score and supporting evidence sit in one view.
Momentum, structure and leadership are shown beside the overall condition.
Less noise. Less indicator hopping. Less time trying to reconcile five different answers.
The product
Everything that matters, brought together in one Technical X-Ray. Start with the answer. Go deeper only when you need to.
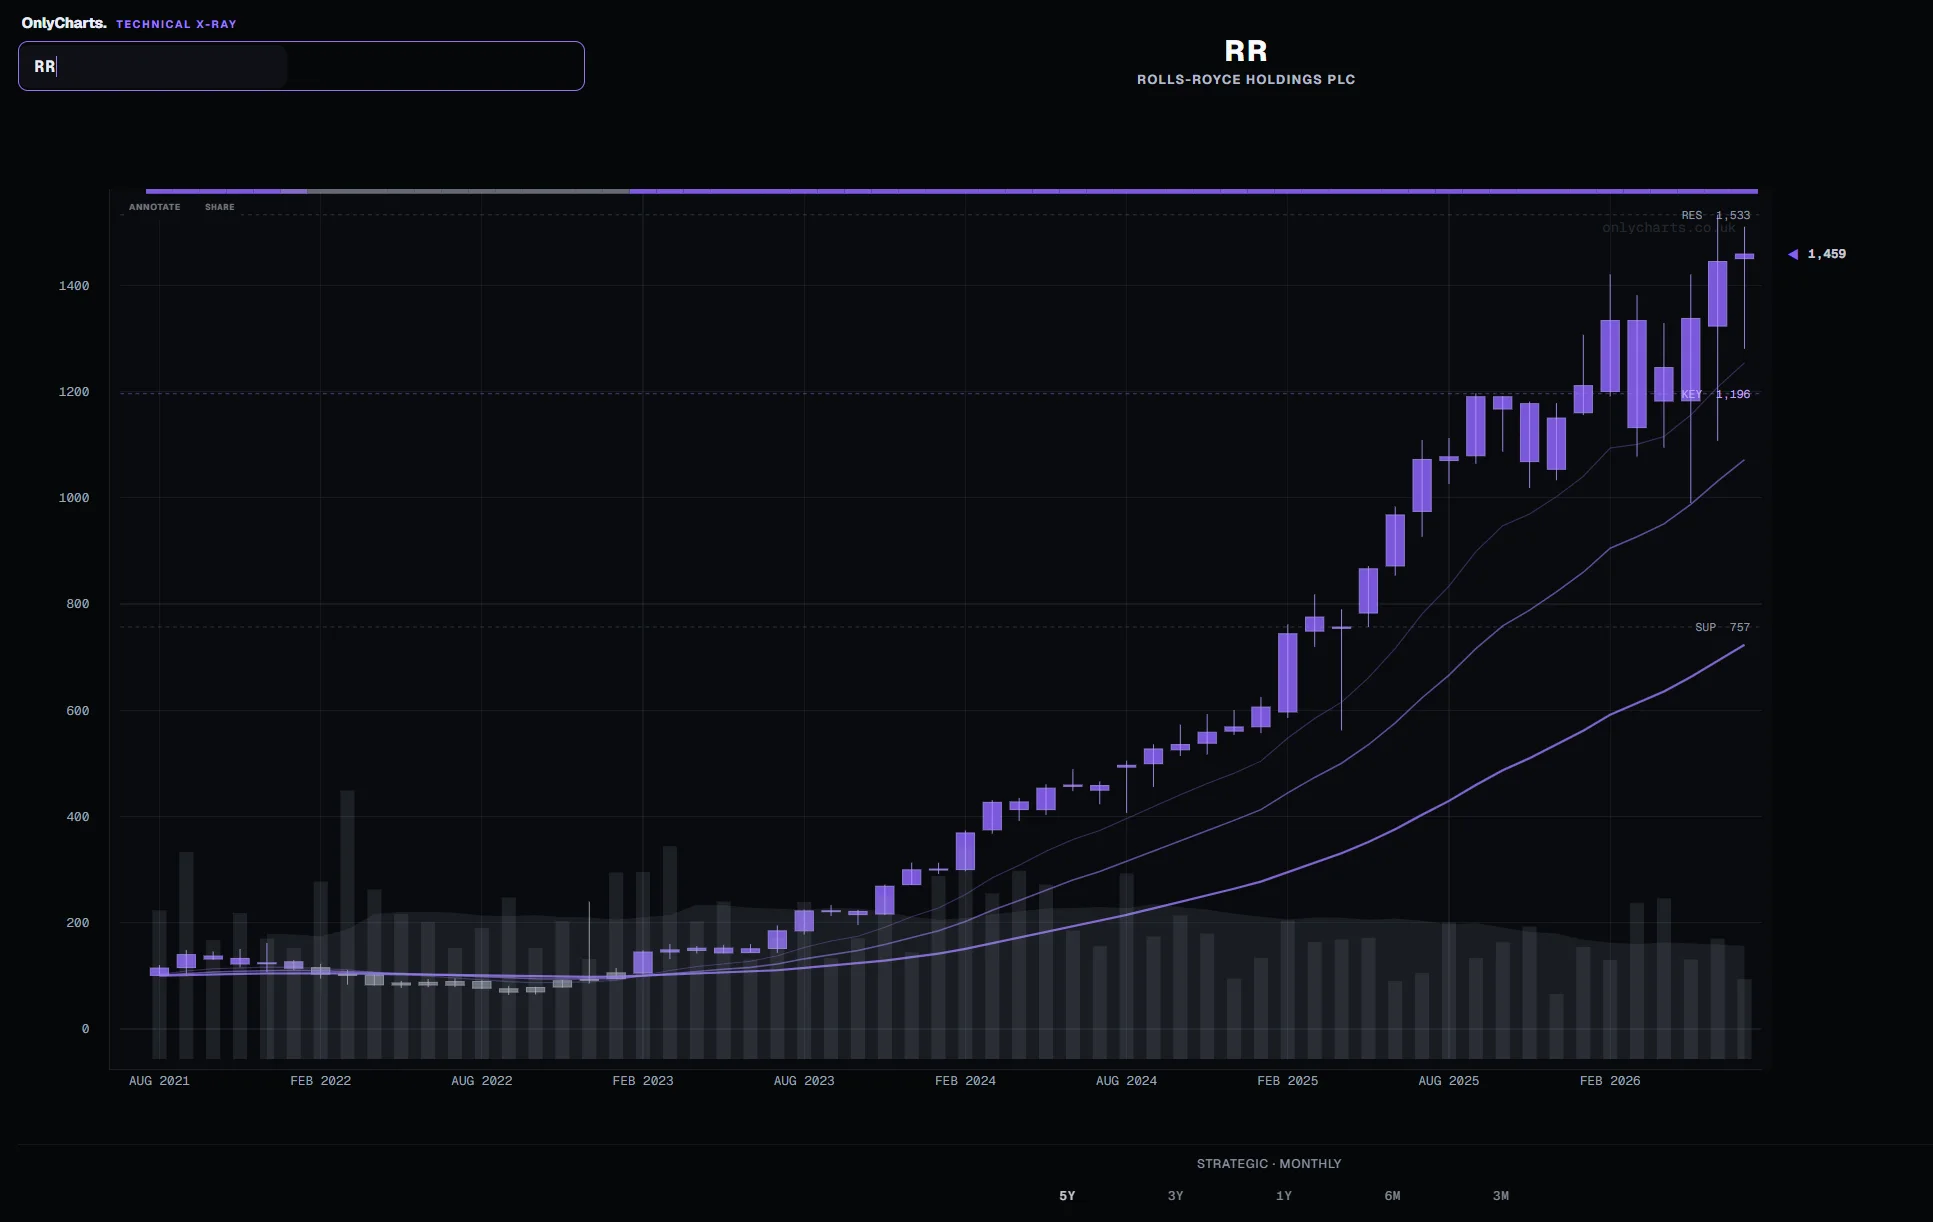
No dashboard maze. No hunt for the signal. The chart stays central while the analysis remains attached to it.
Critical, Weak, Recovering, Healthy or Strong: the first read is plain, consistent and immediately visible.
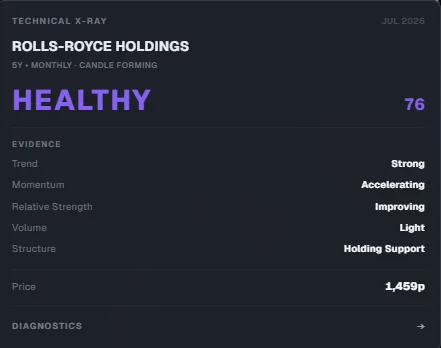
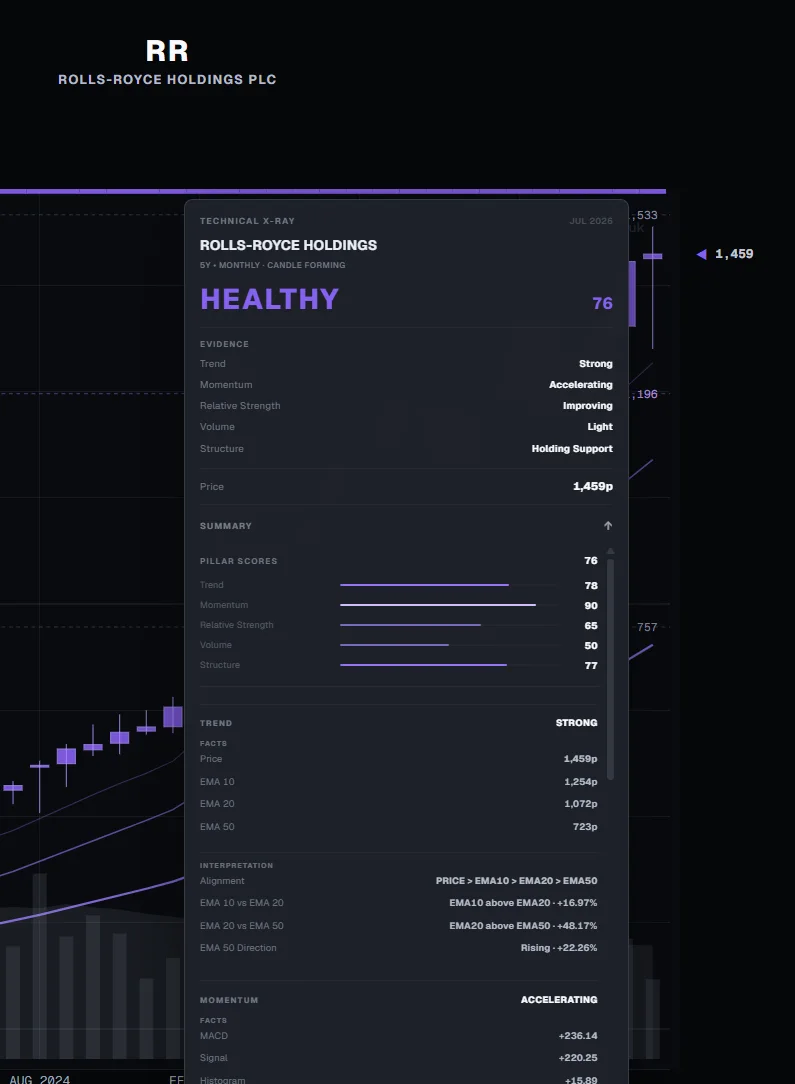
Trend, momentum, relative strength, volume and structure are visible as separate pillars—not hidden behind a label.
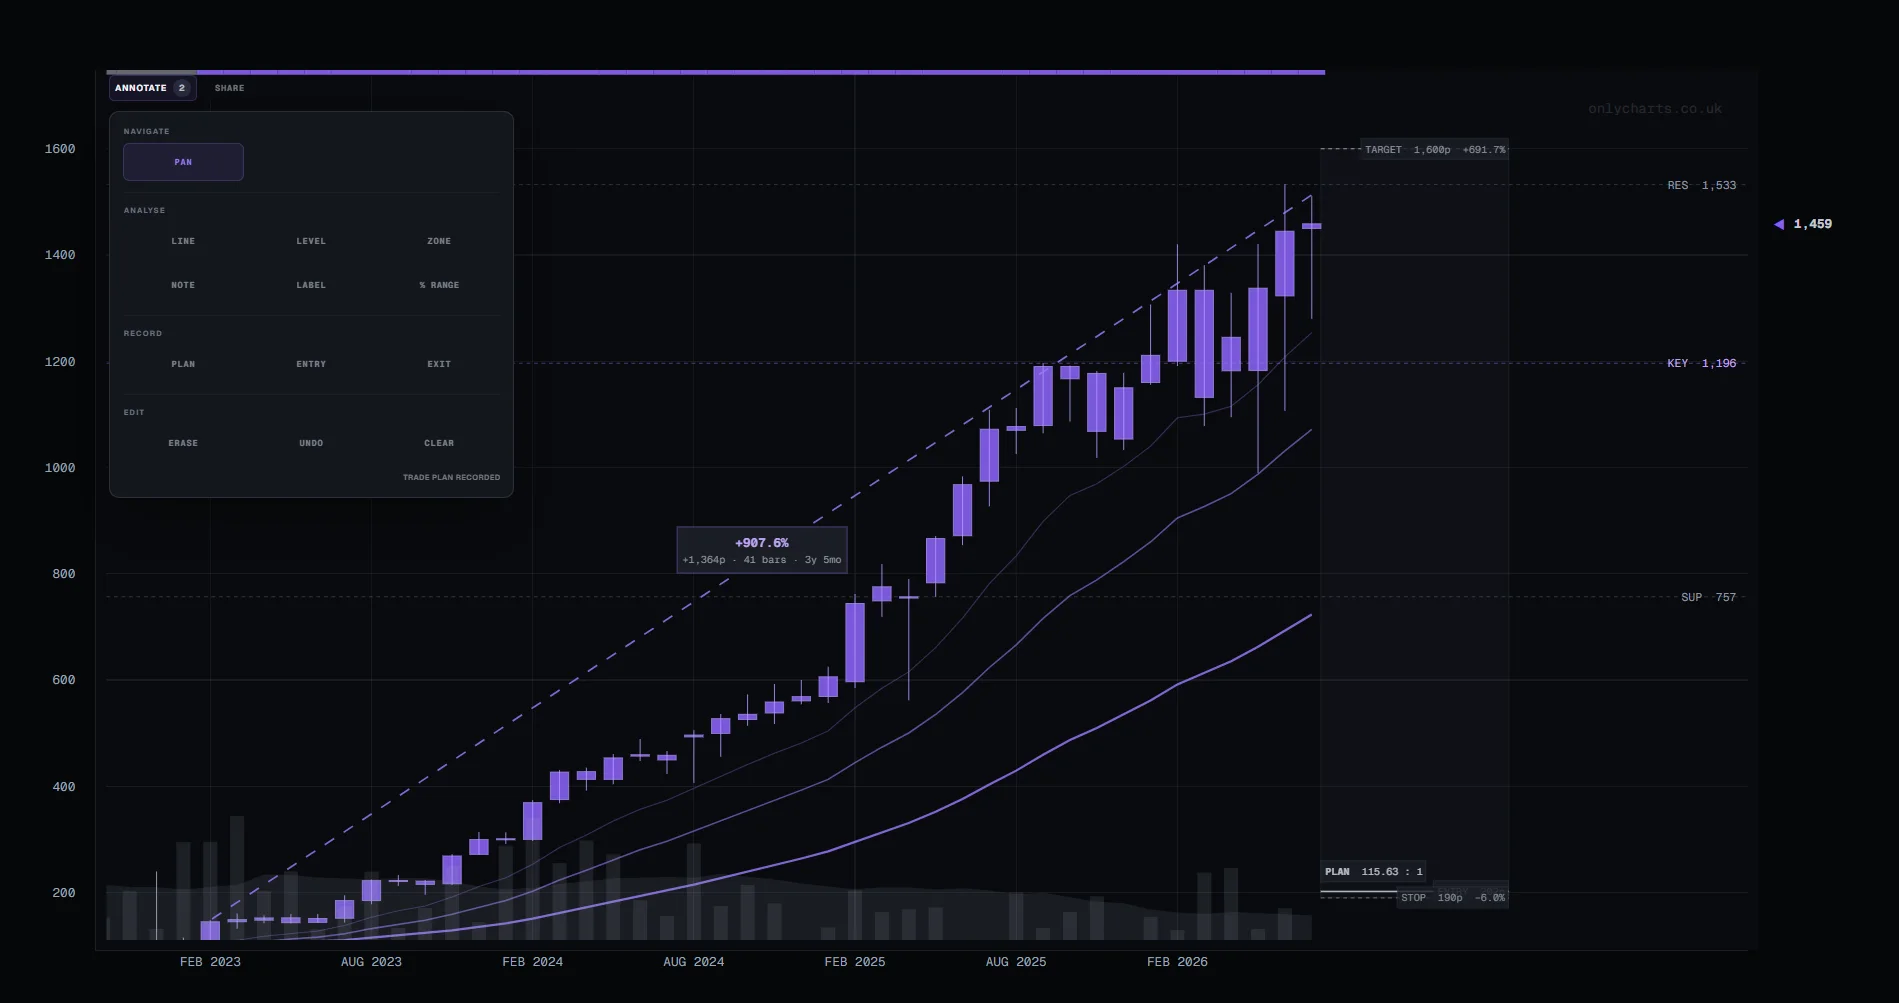
Measure ranges, define levels, add notes and record your own plan. The X-Ray informs the work; it does not replace your judgement.
Transparent by design
OnlyCharts does not ask one indicator to answer every question. It evaluates five independent evidence categories, then synthesises them into a Technical Health Score and diagnosis.
Direction, rail alignment and the condition of the broader trend.
MACD position, expansion, fading and price acceleration.
Whether the share is leading or lagging its market benchmark.
Participation and price-volume pressure relative to the stock’s own norm.
Support, key level, resistance and the chart’s current location.
What clarity changes
See whether the chart is technically damaged, recovering, healthy or strong before you get lost in detail.
Separate strong trend from fading momentum, weak leadership or fragile structure.
Move from tactical daily context to structural weekly and strategic monthly views without rebuilding the chart.
Support, key level and resistance keep the diagnosis anchored to visible chart context.
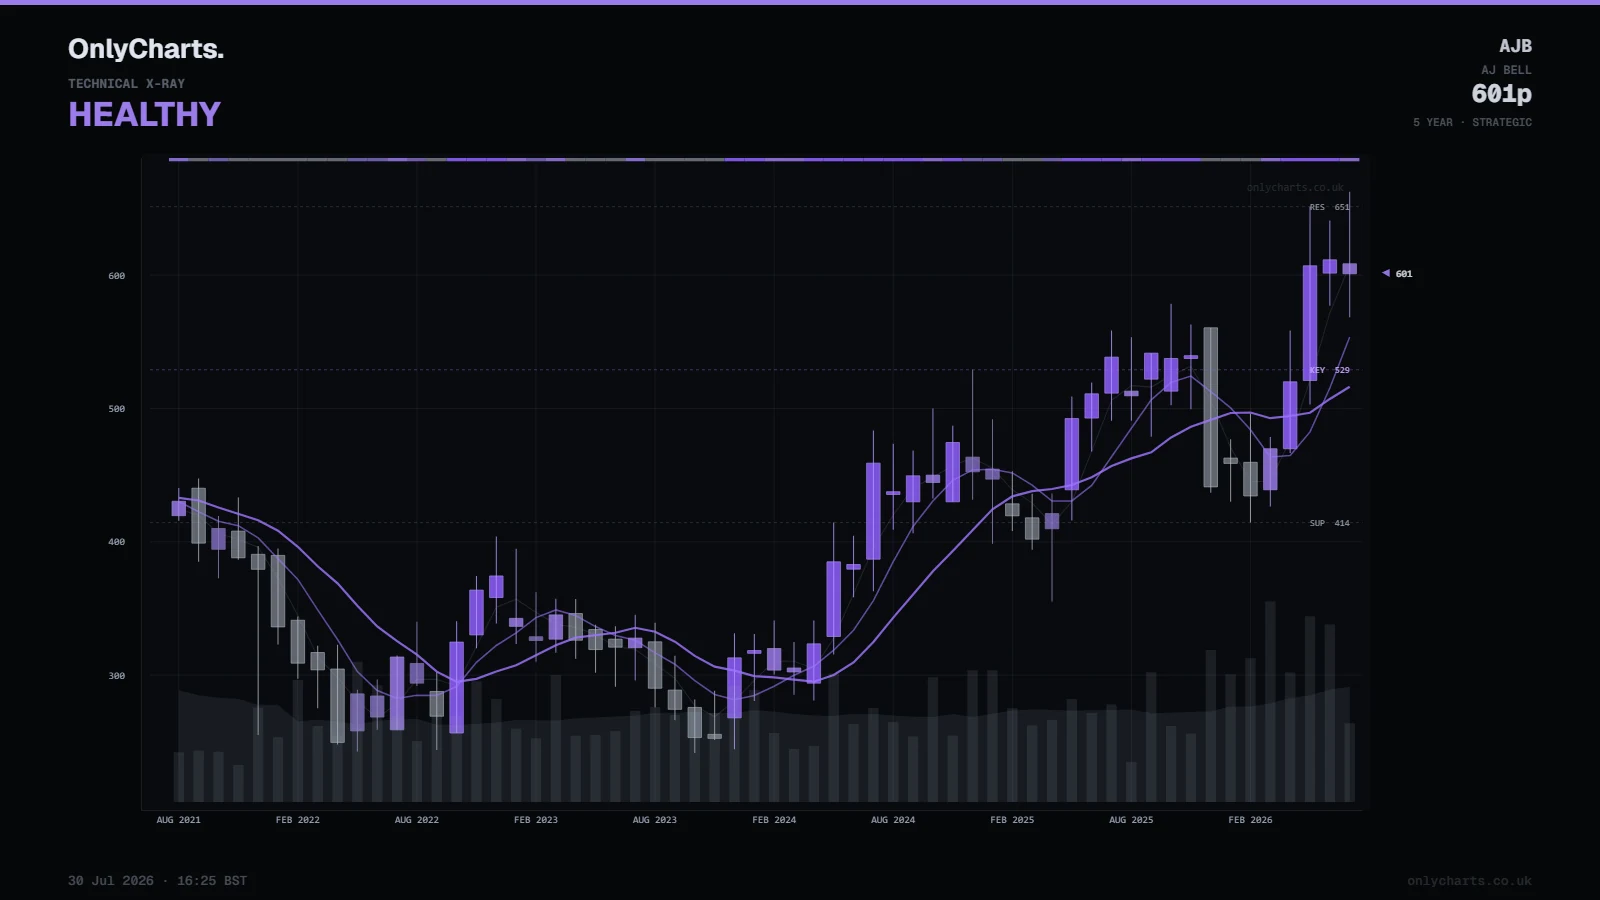
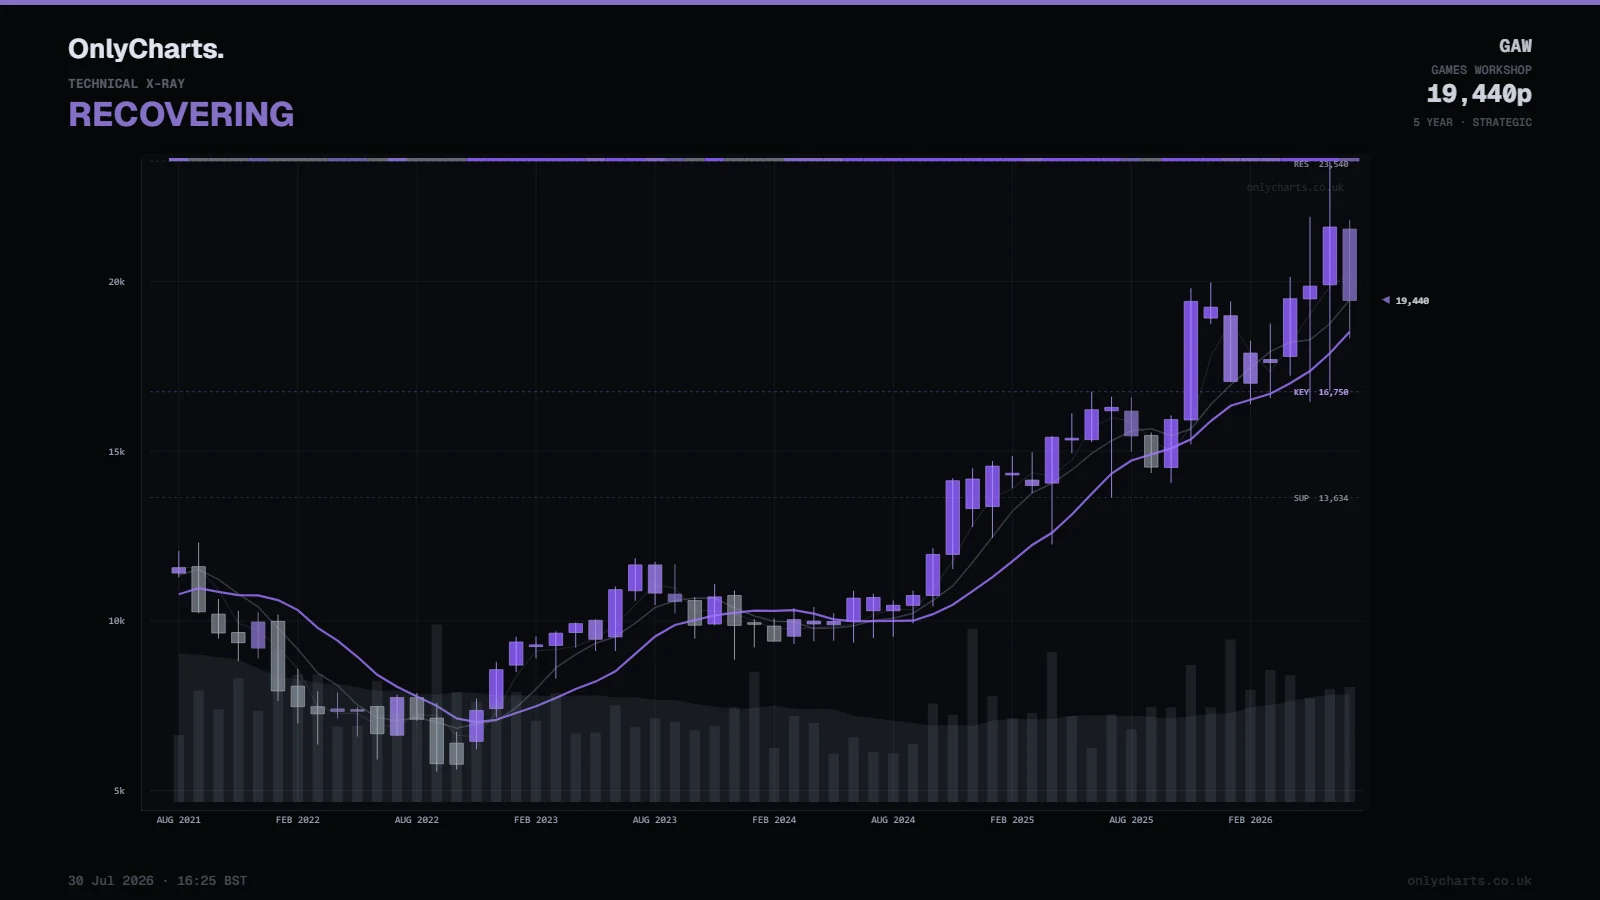
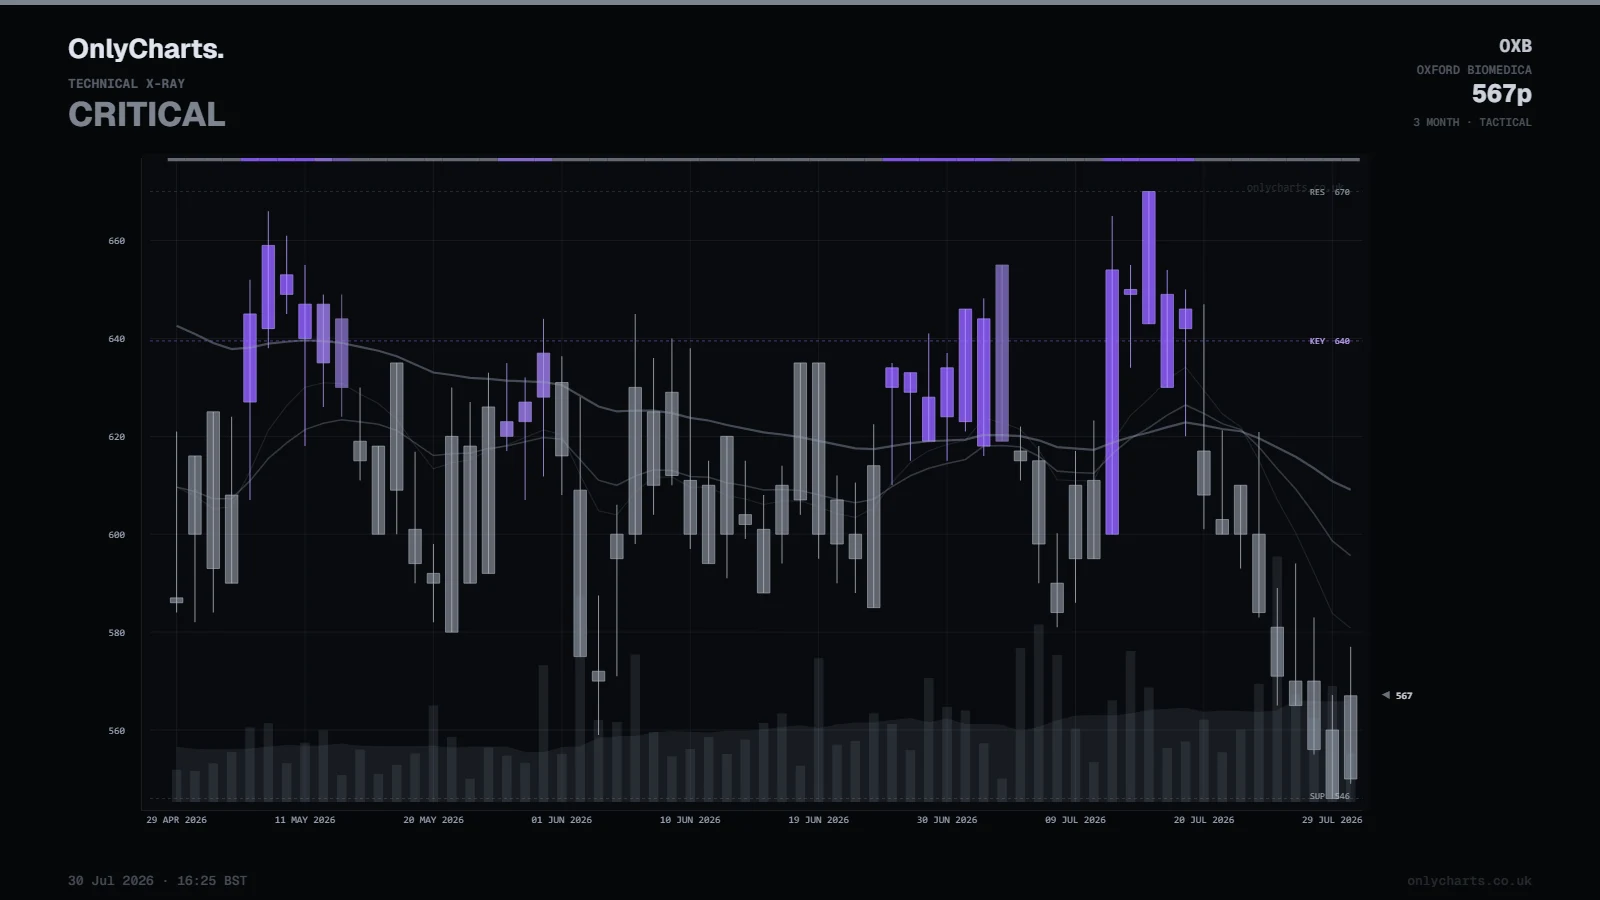
Dated examples
The X-Ray is designed to describe the condition it finds—not to force every chart into a bullish story.
Built for serious chart work
OnlyCharts compresses technical evidence. It does not provide a recommendation, price target or certainty. The value is a clearer starting point, a consistent framework and a visible chain of evidence.
Why I built OnlyChartsThe diagnosis is immediately visible.
The five pillars remain open to inspection.
Every chart is assessed through a consistent framework.
The X-Ray describes the chart; you decide what it means for your research.
See the chart clearly
Enter the ticker. Run the X-Ray. See one score, one diagnosis and the evidence behind both.
Technical analysis is descriptive, not predictive. Not investment advice.