Dated Technical X-Ray example
AJ Bell AJB
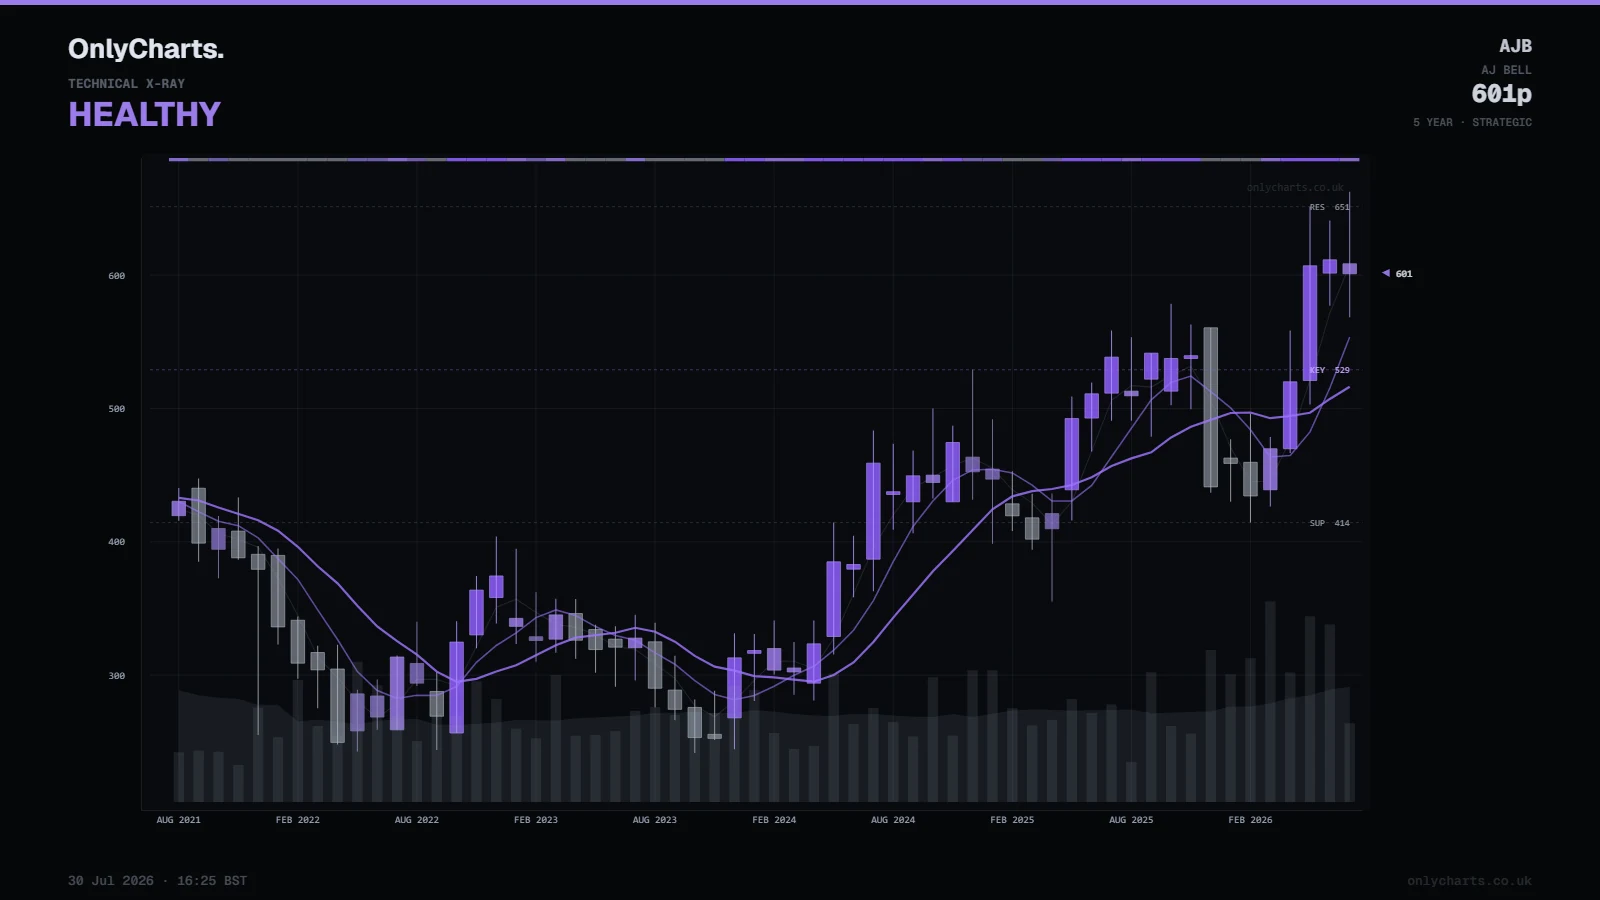
The captured X-Ray describes AJ Bell as Healthy on the five-year monthly view. This page demonstrates how OnlyCharts presents technical condition and supporting chart context.
Condition shownHealthy
View5 year · Strategic monthly
Captured30 July 2026
ReadingHistorical example
What this page shows
A dated example, not a live reading.
The chart image records the Technical X-Ray displayed at the stated time. Technical conditions change as new market data is added, so the diagnosis shown here should not be treated as the current reading.
OnlyCharts is descriptive rather than predictive. It organises technical evidence for research and education and does not provide a recommendation or price forecast.
DiagnosisThe plain-language technical condition displayed when the image was captured.
Trend contextPrice viewed against the trend rails relevant to the selected timeframe.
Reference levelsSupport, key level and resistance provide chart context rather than forecasts.
Volume contextParticipation is displayed alongside price so the wider behaviour remains visible.
Latest Technical X-Ray
View the current AJB chart.
Open the live product to see the latest diagnosis, score and supporting evidence.