A share can be rising and still be weak.
If its benchmark is rising faster, the stock is losing ground in relative terms. Equally, a flat share can be demonstrating strength when the wider market is falling.
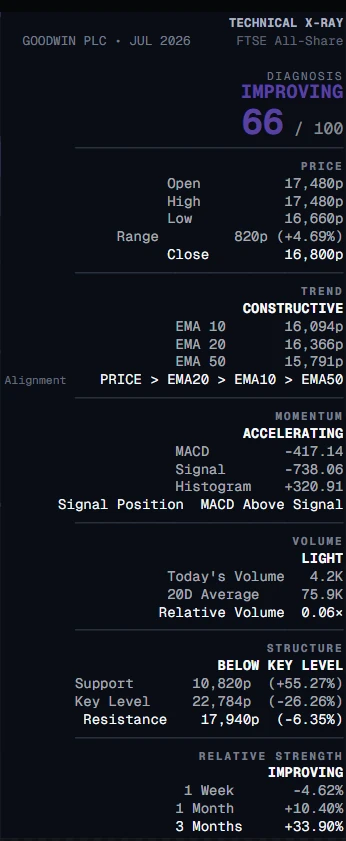
OnlyCharts measures market-relative performance. It is not the RSI oscillator: it compares the stock’s return with the benchmark shown in the X-Ray.
Measure the edge, not just the return.
For each displayed window, OnlyCharts subtracts the benchmark’s percentage return from the stock’s return over the same period. A positive result means the stock is ahead; a negative result means it is behind.
Example
If a stock rises 8% while its benchmark rises 3%, the relative-strength result is approximately +5 percentage points. If the stock falls 2% while the benchmark rises 3%, the result is approximately −5 points.
Use three windows, not one snapshot.
Each window answers a different question about leadership.
| Window | What it adds | Question |
|---|---|---|
| 1 Week | Short-term temperature | Is relative performance improving or cooling now? |
| 1 Month | Recent confirmation | Is the current swing outperforming the market? |
| 3 Months | Leadership context | Has the stock established a meaningful edge over the benchmark? |
Read the windows together. Strong three-month leadership with a slightly negative week can be a pause. Negative readings across all three windows describe a broader lagging condition.
Read the combination.
The current X-Ray may summarise relative strength as Leading, Improving, In Line, Lagging or Weak, depending on the combination of available windows.
The benchmark changes the meaning.
The benchmark shown in the X-Ray is the comparison point for the scan. For a UK-listed share, this may be a broad UK market benchmark such as the FTSE All-Share. The purpose is to compare the stock with a relevant market backdrop rather than an unrelated overseas index.
Benchmark data can be unavailable or incomplete. When that happens, relative-strength evidence should be shown as unavailable rather than replaced with an invented result.
Leadership is stronger when the chart agrees.
Relative strength is most persuasive when it agrees with price structure and trend. A stock reclaiming a key level while its one-month and three-month relative strength improve is behaving differently from one that drifts higher but continues to lag.
Leadership can also become stretched. Strong relative performance does not make every price a good entry and does not remove fundamental or liquidity risk.
Avoid the common relative-strength mistakes.
- Confusing relative strength with the RSI indicator.
- Looking at the stock’s return without checking the benchmark.
- Overreacting to one weak week after strong three-month leadership.
- Calling a stock a leader when only one short window is positive.
- Using relative strength as a standalone buy or sell signal.