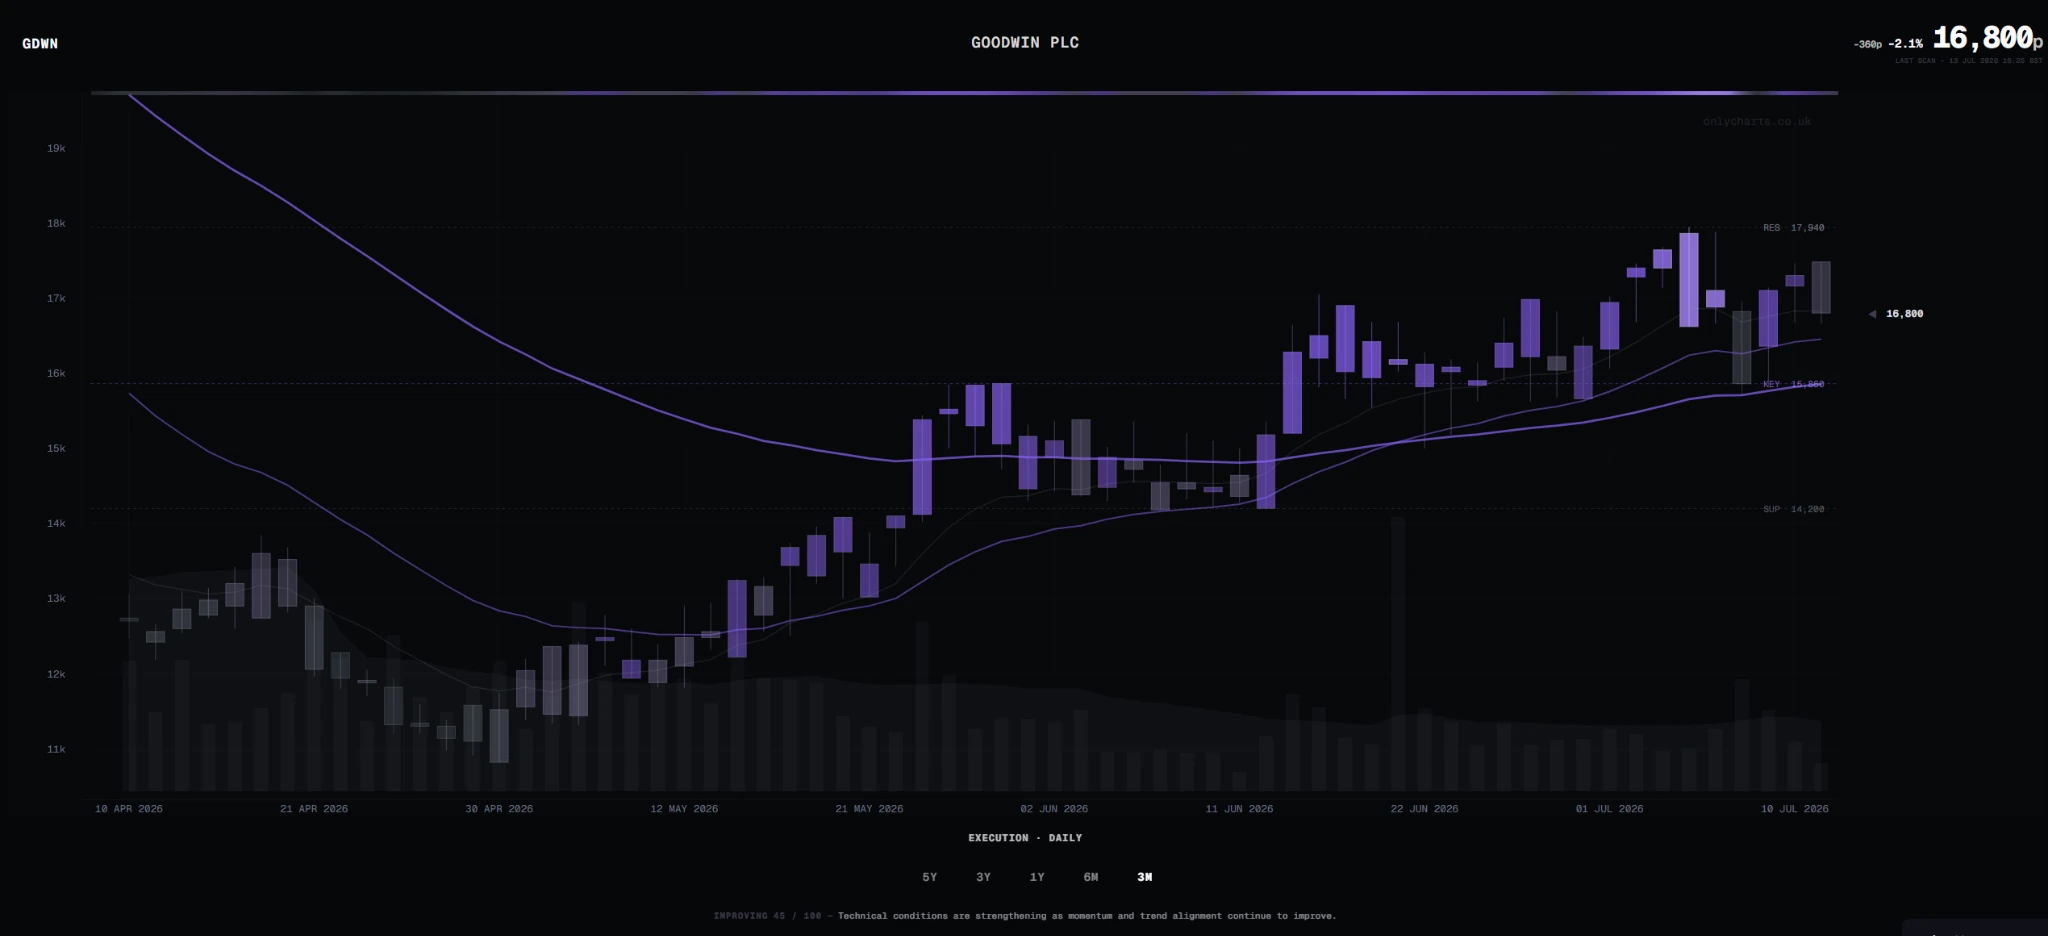
Price becomes easier to interpret when you know where it sits inside the current structure.
OnlyCharts shows three structural reference points. Together, they explain whether price is holding the lower part of its range, reclaiming the internal decision area or pressing into overhead supply.
Treat levels as areas, not exact answers.
The displayed values are systematic reference lines, but real markets do not turn at one perfect tick. This matters particularly in small caps, where spreads, gaps and thin trading can push price through an exact number temporarily.
Treat the line as the centre of an area. Watch whether price closes through it, retests it, rejects it or holds around it with supporting participation and momentum.
Read the relationship, not the label in isolation.
The structure label describes where price sits now. The surrounding trend, momentum and volume determine how much confidence that relationship deserves.
Price has interacted with a lower reference area and remained above it.
Shows which side of the internal chart-changing level price currently occupies.
Confirmed swing behaviour is beginning to improve.
Price remains inside the current structural range without a decisive change.
Price is above the prior resistance reference. Confirmation still matters.
The lower reference has failed on the current read.
Location changes the quality of the read.
The percentage shown beside a level expresses the distance between the current price and that reference. It is not a projected return or target.
Two charts with similar diagnoses can occupy very different locations. A share just above support has a different structural position from the same share after a rapid move toward resistance.
A line break still needs evidence.
A move above resistance becomes more meaningful when trend, momentum, relative strength and participation improve together. A move that briefly crosses the line and then closes back inside the range is less convincing.
OnlyCharts does not guarantee that a breakout will hold. The following candles, volume and behaviour on a retest provide the next evidence.
Every timeframe has its own structure.
The 3M execution view uses recent daily structure. The 3Y structural view uses weekly bars and can surface much larger levels. Neither is universally “correct”; each belongs to a different decision horizon.
When a short-term level sits inside a major long-term resistance area, the longer structure deserves priority in the broader interpretation.
Use levels to frame the next question.
Levels help define what the chart needs to prove: where does the current structure weaken, what must price reclaim to improve the read, and how much overhead supply remains? They do not determine a personalised stop, target or position size.